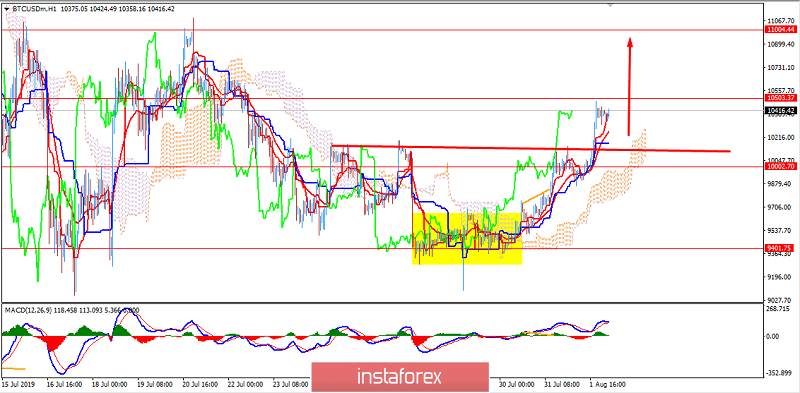
Bitcoin gained steady momentum and formed a Rounded Bottom price pattern while breaking above $10,000 with a daily close.
According to the recent report, 85% of the Bitcoin has been already mined and that can create scarcity after a certain period and increase the value of Bitcoin in the future. Despite the fact that Bitcoin is 50% down from its all-time high of $20,000, the project has continued to set milestones. According to one model, BTC's inflation rate, as shown by the stock-to-flow model, determines the price of the asset. The higher the SF ratio, the lower the inflation rate that a commodity has, therefore, the higher the value of the asset should be.
Bitcoin's bulls and bears have been locked in a fierce battle over the past few days, with buyers attempting to push BTC firmly into the five-figure price region, while sellers have been attempting to push the cryptocurrency below the key psychological price region of $10,000. This price action is emblematic of the new trading range that Bitcoin has found itself caught within, and the lack of any major momentum in one direction or another has led to a division amongst the market participants where some targeting Bitcoin's 2019 highs of $13,800, while others believe it will revisit $8,800 which, at the current price pattern formation, is quite unlikely.
As for the current scenario, Bitcoin is approaching $10,500. In case this level is broken, the further upward movement towards $11,000 or higher is expected in the coming days.
TECHNICAL OVERVIEW:
Currently, the price is above $10,350 continuing its rally. The price is restrained by the dynamic level of 20 EMA, Tenkan, and Kijun line, while the Chikou Span is indicating further upward pressure. MACD has no Bearish Divergence indicating that bearish bias is not strong. The price has also formed CUP & HANDLE, a bullish pattern which indicates a further uptrend. As far as the price remains above $10,000 with a daily close, a further uptrend is expected. However, how impulsive the overall momentum will be is still a question to be answered when the market price action unfolds.
TECHNICAL LEVELS:
SUPPORT- 9,500 / 9,800 / 10,000
RESISTANCE- 10,500 / 11,000 / 11,500 / 12,000
CURRENT BIAS- Bullish
MOMENTUM: Non-Volatile


