


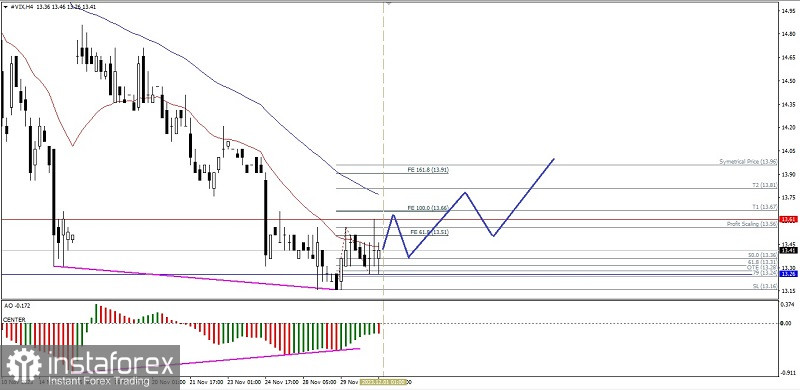
On the 4-hour chart, the S&P 500 Volatility Index, even though the 21 EMA is below the 55 EMA, indicates that Sellers are still dominant, but the emergence of deviations between price movements and the Awesome Oscillator indicator gives an indication that in the near future #VIX has the potential to be corrected to strengthen up to the level of 13.75 as the main target and the 13.96 level as the next target if the momentum and volatility are supportive, but if on its way to these targets suddenly the #VIX weakens again, especially if it breaks below the 13.16 level, then the strengthening correction scenario described previously will cancel itself.
(Disclaimer)


