


Overview:
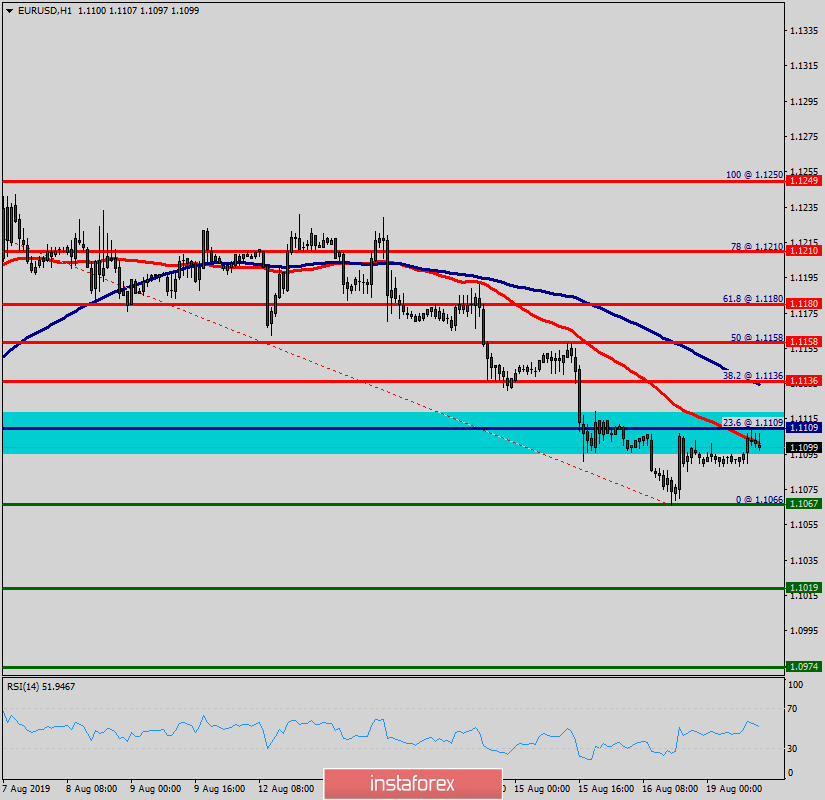
The EUR/USD pair opened below the weekly resistance 1 (1.1136). It continued to move downwards from the level of 1.1136 towards the spot of 1.1109 (the pivot point).
Today, the first resistance level is currently seen at 1.1136, the price is moving in a bearish channel now.
The RSI starts signaling a downward trend. As a result, if the EUR/USD pair is able to break out the first support at 1.1067, the market will decline further to 1.1019 in order to test the weekly support 2.
Further close below the low end may cause a rally towards 1.0974. Nevertheless, the weekly support level and zone should be considered.
In the H1 time frame, the pair will probably go down because the downtrend is still strong. Consequently, the market is likely to show signs of a bearish trend.
So, it will be good to sell below the level of 1.1136 with the first target at 1.1067 and further to 1.1019.
At the same time, the breakup of 1.1136 will allow the pair to go further up to the levels of 1.1249 so as to test the doblle top.


