


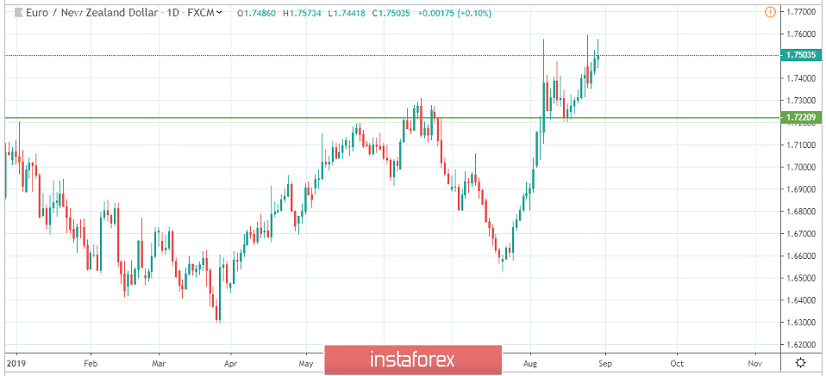
The picture shown above is the daily chart of EUR/NZD. Green line represents the resistance point, which has turned into support. The pair has been following the uptrend for many weeks, thus proving the strength of the trend. The price is currently approaching a minor resistance point, from where there has been a couple of reactions before. All those traders who are willing to follow the trend should drop the plan right away. There are no more long trades on this particular chart. Two sets of trades might set up in the next few days. The first trade is a long trade. You can go long here when the price pulls back to the green line and gives confirmation with your technical indicators. Divergence would give you the right entry time. In this long trade, your stop loss can be placed at 1.71000, with a target of 1.75000. Your risk to reward ratio will be 1:2. The long trade is only for those who have a higher risk appetite. The second trade is a trade on the short side. Since it can take longer than expected, a lot of patience is required. In order to take a short trade, a bearish candle formation below the green line would be prominent. From the point of technical analysis, an exhaustion candlestick pattern would be nice. Then you could take the sell safely. Your stop loss will be above the green line, and the target will be around 1.66000. The recommendation is to take the sell as it offers minimum risk with a nice risk to reward ratio.


