


Gold has reached very close to the 161.8% extension of the August 2018- February 2019 rise. This was our second target area and we observe that the weekly RSI has reached overbought levels that preceded big corrections in the past.
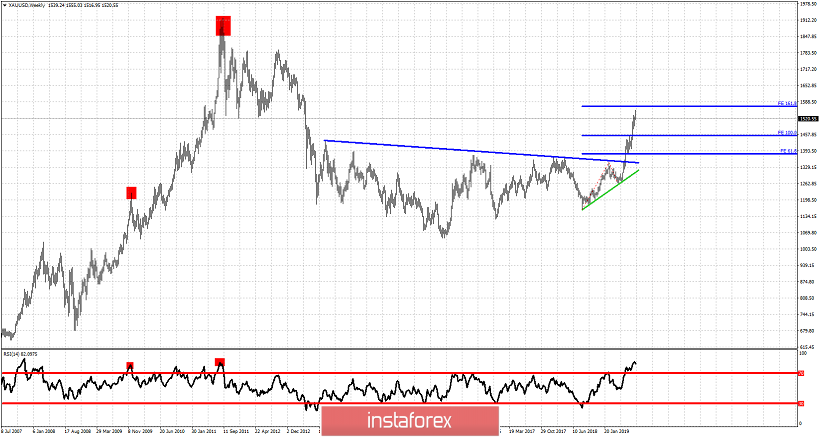
Red rectangles - RSI overbought tops
Gold price closed the week at $1,520 with a high at $1,555. Our 161.8% target was at $1,570. Gold could continue higher this week towards that level. However the RSI is at overbought levels that in the past have lead to corrections if not bear market. Bulls need to be very cautious. Key support is found in the short-term at $1,500-$1,490. Most probable pull back target area is at $1,400-$1,450. If the RSI breaks below 70 then top is in.


