


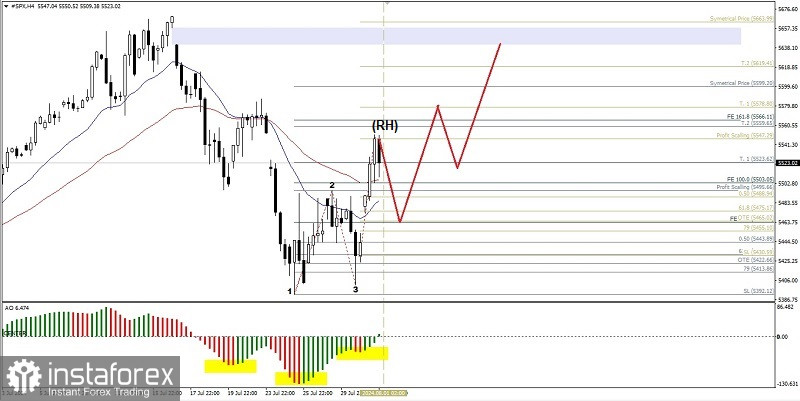
If we look at the 4-hour chart of the S&P 500 index, there are 3 interesting things, first is the movement of the #SPX price which is above the EMA 20 & EMA 50, second is the appearance of the Bullish 123 pattern followed by the Bullish Ross Hook (RH) and the last is the Awesome Oscillator indicator forming an Inverted head & Shoulders pattern where these three things provide clues and confirmation that in the near future #SPX has the potential to strengthen where if the level of 5566.11 is successfully broken upwards then #SPX will continue to strengthen to the level of 5599.20 as its main target and if the momentum and volatility support it then 5641.52 will be the next target to be aimed for but if on the way to these targets suddenly there is a weakening correction that penetrates below the level of 5392.12 then all the strengthening scenarios that have been described previously will be invalid and canceled by themselves.
(Disclaimer)


