Technical Market Overview:
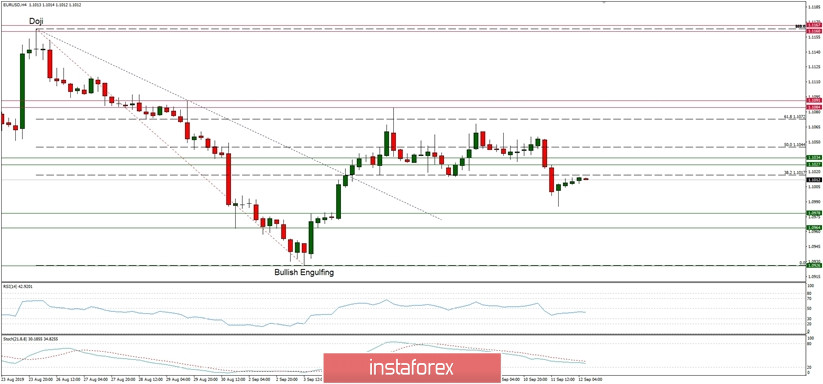
The EUR/USD pair broke out of the narrow horizontal range after the second try to rally and is testing the lower levels. In order to regain control over the price, the bulls have to break through this level and go higher towards the next target located at the level of 1.1091 and then at 1.1167, but currently, the bullish momentum is decreasing as the RSI indicator moves below the level of 50 in neutral market conditions. The larger timeframe trend remains down, but the Ending Diagonal price pattern on Weekly and Daily timeframe charts is still valid.
Weekly Pivot Points:
WR3 - 1.1261
WR2 - 1.1174
WR1 - 1.1105
Weekly Pivot - 1.1012
WS1 - 1.0944
WS2 - 1.0856
WS3 - 1.0789
Trading Recommendations:
The best strategy for current market conditions is to trade with the larger timeframe trend, which is down. All upward moves will be treated as local corrections in the downtrend. The downtrend is valid as long as it is terminated or the level of 1.1445 clearly violated. There is an Ending Diagonal price pattern visible on the larget timeframes that indicate a possible downtrend termination soon. The key short-term levels are technical support at the level of 1.0814 and the technical resistance at the level of 1.1267.