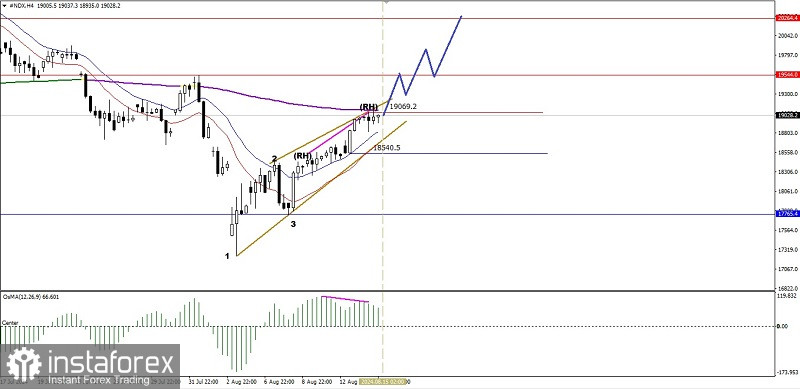
Although the Nasdaq 100 index price movement is currently below its EMA 200, indicating that #NDX is under Seller pressure, with the appearance of the Bullish 123 pattern followed by the Bullish Ross Hook (RH) and confirmed by the movement of #NDX which has also been above the WMA 20 by its High, this indicates that #NDX is experiencing a strengthening correction where it is currently trying to test the level of 19069.2 if this level is successfully broken upwards then #NDX has the opportunity to continue its strengthening to the level of 19544.0 as its main target and if the momentum and volatility support it, the next level to be targeted is 20264.4 but please be careful also because of the emergence of the Rising Wedge pattern and the deviation between the #NDX price movement which is making higher-high while the MACD Histogram indicator is actually making higher-low, so if on its way to these targets suddenly #NDX weakens again to below the level of 18540.5 then all the strengthening correction scenarios that have been described previously will be invalid and automatically cancelled by itself.
(Disclaimer)


