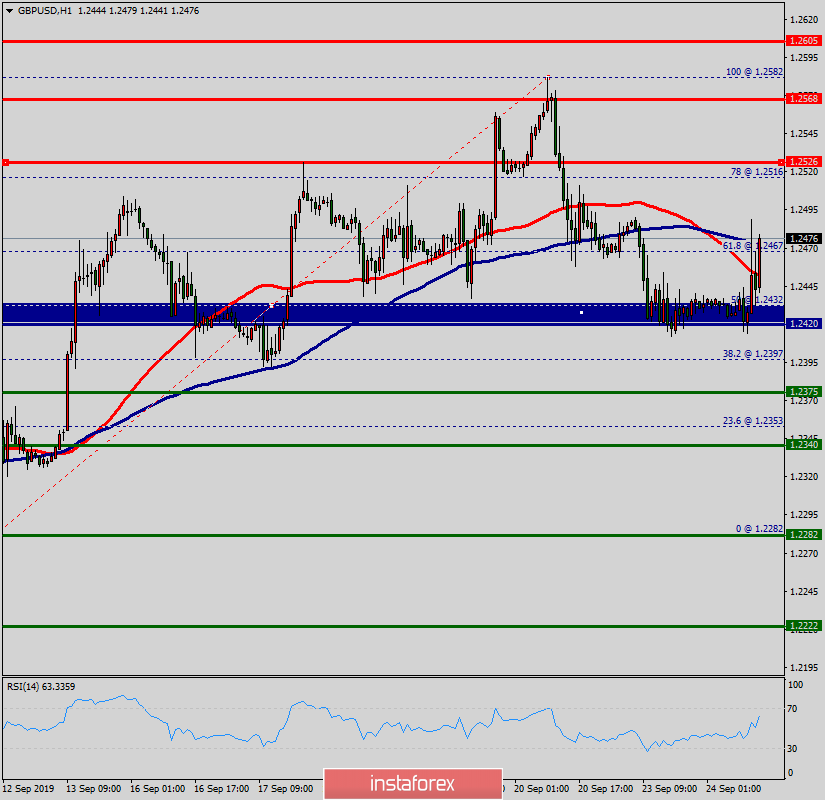
The GBP/USD pair is calling for bullish trend as long as the price is above the 1.2420 level. A upward impulse is anticipated to persist up to a area high at the 1.2526 at least. Note that intraday resistance level seen is at the 1.2526 price. Major resistance is seen at 1.2568, while immediate support is found at 1.2420 . The depicted support level of 1.2420 acted as a prominent key level offering a valid buy entry. The signal for entering the market is formed to buy again. The RSI shows an increase in the volume of long positions and 100 and 50-moving avergae are directed upwards. Further close above the high end may cause a rally towards 1.2420. Nonetheless, the daily resistance level and zone should be considered. Accordingly, the USD/CHF pair is showing signs of strength following a breakout of a high at 1.2420. So, buy above the level of 1.2420 with the first target at 1.2526 in order to test the daily resistance 1 and move further to 1.2568. Also, the level of 1.2568 is a good place to take profit because it will form the second resistance today. Amid the previous events, the pair is still in an uptrend; for that we foresee the GBP/USD pair to climb from 1.2420 to 1.2605 in coming hours. However, in case a reversal takes place and the GBP/USD pair breaks down the support level of 1.2420, then a stop loss should be placed at 1.2370.


