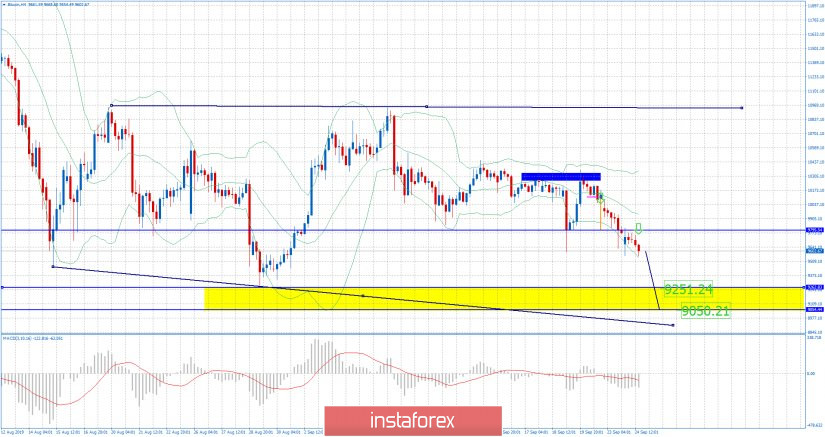
Bitcoin has been trading downwards in the past 24h as I expected yesterday. The BTC tested the level of $9.593 again and is trying to break it. Momentum is still on the downside and my advice is to watch for selling opportunities on the rallies.

Blue line – Support became resistance
Yellow rectangle – Support cluster and downward objective
Purple falling line – Expected path
MACD oscillator is showing new momentum down, which is sign that sellers are still present and strong. Bollinger band is expanding bands, which is another confirmation that volatility is increasing. Support levels are seen at the price of $9,250 and $9,050 and the resistance levels at $9,795.


