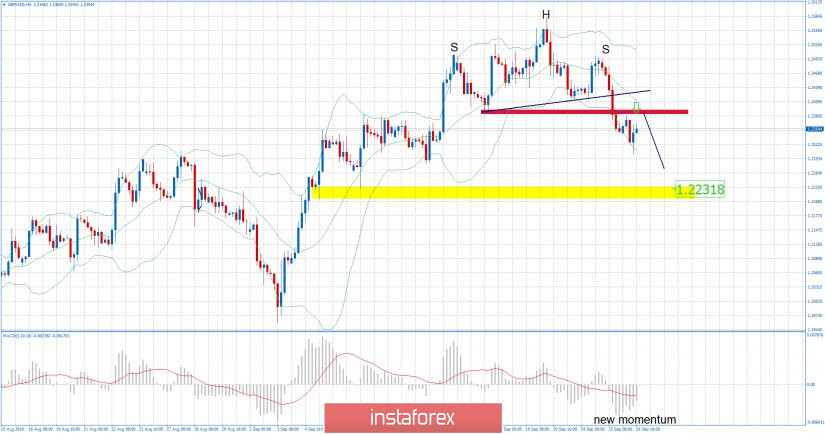
GBP/USD has been trading downwards as we expected. The head and shoulders pattern is confirmed based on 4H time-frame and I do expect more downside yet to come. The downward target is set at the price of 1.2230.

Red rectangle – Important resistance level
Yellow rectangles – Support level and objective target
Purple falling line – Expected path
MACD oscillator is showing the new momentum low in the background, which is indication for the domination of sellers. Any decent rally into the resistance may produce good sell entry. Support levels are seen at the price of 1.2304, 1.2282 and 1.2230. Resistance levels are set at 1.2380 and 1.2415. Watch for selling opportunities.


