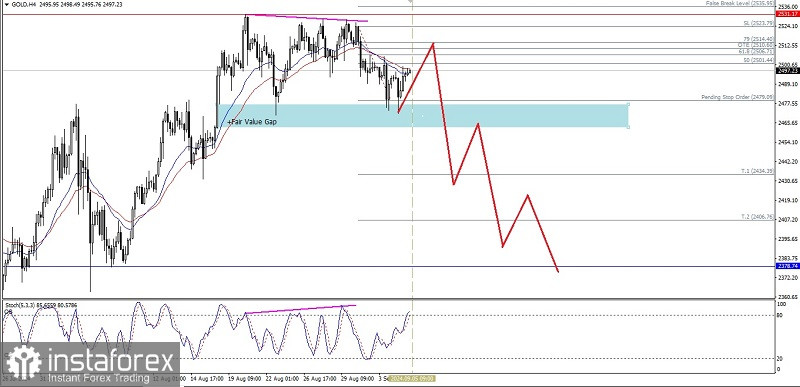
From what we can see on the 4-hour chart, the Gold commodity asset price movement appears to form a Higher High while the Stochastic Oscillator indicator actually forms a Higher Low. From here we can conclude that there is a hidden deviation which indicates that there is a weakening of momentum in the Gold commodity asset so that as long as there is no strengthening that breaks through and closes above the level of 2535.95, Gold will try to break the Support Area level formed from the Bullish Fair value Gap area, especially if Gold manages to break below the level of 2462.38, then today Gold has the potential to weaken to the level of 2434.39. If this level is also successfully broken, 2406.76 and 2378.74 will be the target destinations that Gold will head to today, especially if the momentum and volatility support it.
(Disclaimer)


