


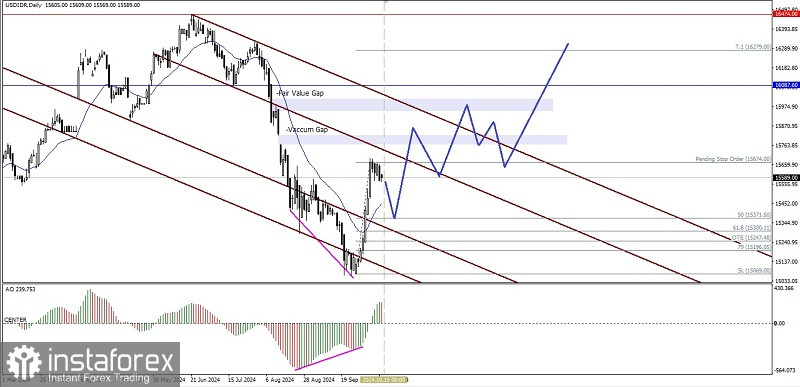
On the daily chart of the exotic currency pair USD/IDR, there appears to be a deviation between the USD/IDR price movement and the Awesome Oscillator indicator plus confirmation of its price movement which is above the EMA 21 which has an upward slope also provides an indication and confirmation that in the next few days the USD has the potential to strengthen against the Garuda currency where the level of 15674 will be tested to be broken and close above it. If it is successful, the USD will continue to strengthen against the Rupiah currency to the level of 16087.60 as its main target and if the momentum and volatility support it, 16279 will be the next target to be achieved, but all of these USD strengthening scenarios will be invalid if on its way to the levels described previously it suddenly turns weak and falls to break and close below the level of 15196.05.
(Disclaimer)


