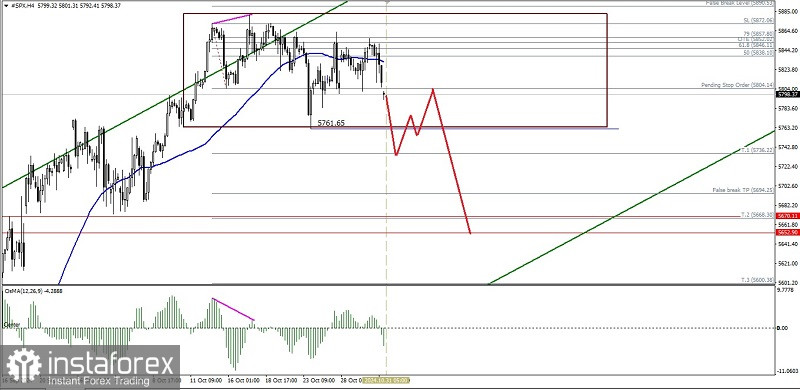
From what we can see on the 4-hour chart, the S&P 500 index appears to be moving in a sideways condition, this is confirmed by the MA (50) condition that moves between the Candlestick bodies, but because the current price movement of #SPX is below its MA (50) and there is also a deviation between the price movement and the MACD Histogram indicator (osMA 12,26,9) then in the near future #SPX has the potential to weaken and will fall to test the level of 5761.65 if this level is successfully broken then 5694.25 has the potential to become the next main target to be targeted and if volatility and momentum support it, it is not impossible that today 5652.90 will become the next target, only if on its way to the previously described target levels, there is suddenly a significant strengthening correction, especially if #SPX strengthens again to break and close above the level of 5890.53 then all the weakening scenarios that have been described previously will become invalid and automatically canceled by themselves.
(Disclaimer)


