


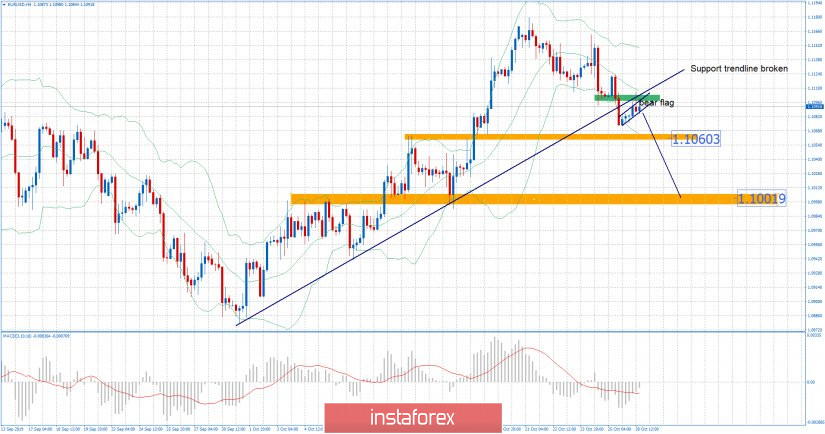
EUR/USD has been trading sideways at the price of 1.1090. Anyway, I found the breakout of very important support trend line in the background, which is sign that sellers are still present. My advice is to watch for selling opportunities with the first target at 1.1060.
Green rectangle – Support became resistance
Orange rectangles – Support levels and downward objectives
Falling purple line – Expected path
Based on the 4H time-frame, I found the bearish flag pattern in creation just after the breakout of the upward trendline, which is good sign for potential downward continuation. Resistance level is seen at the price of 1.1106 and support levels at 1.1060 and 1.1000.
MACD oscillator did show new momentum down based on the last down move, which is another good confirmation of the EUR weakness.
Selling opportunities are preferable with targets at 1.1060 and 1.1000.


