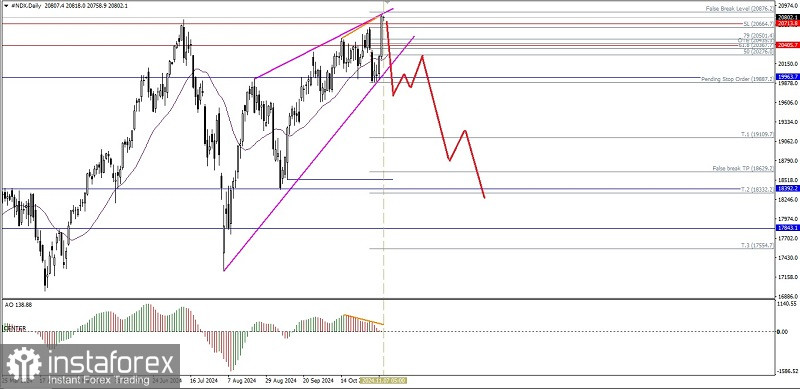
Although on its daily chart the Nasdaq 100 index is moving above the WMA (30 Shift 2) but with the appearance of deviations between the price movement of #NDX and the Awesome Oscillator indicator and the detection of the Rising Wedge pattern, it gives an indication that in the next few days #NDX has the potential to be corrected to weaken down to the level of 19887.2 if this level is successfully broken and #NDX closes below it then 18332.2 will be the main target to be aimed for even if the volatility and momentum of the weakening support then 17843.1 will be the next target but all of this will be invalid if on its way to these targets there is suddenly a significant strengthening especially if #NDX strengthens again until it successfully break and closes above the level of 20876.2.
(Disclaimer)


