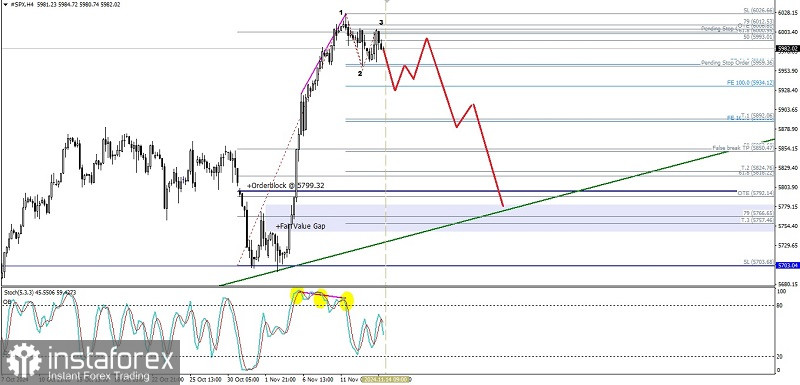
If we look at the 4-hour chart of the S&P 500 index, a Bearish 123 pattern appears which is followed by a deviation between the price movement and the Stochastic Oscillator indicator which also forms a Head & Shoulders pattern so that based on these two facts in the near future it is predicted that #SPX will experience a weakening where in the near future the level of 5959.36 will be tested if it is successfully broken and closes below that level then #SPX has the potential to continue its weakening to the level of 5892.06 and if the volatility and momentum of the weakening support then 5824.76 will be the next target but if on its way to these targets suddenly there is a significant strengthening especially if #SPX strengthens up to penetrate and close above the level of 6026.66 then all the predictions of the weakening that have been described previously will be invalid and automatically canceled by themselves.
(Disclaimer)


