


Gold price has fallen near $1,450 but now it shows signs of a weakening down trend and a possible upside reversal. Technically there is no reversal sign yet but there are warnings for bears that should not be ignored.
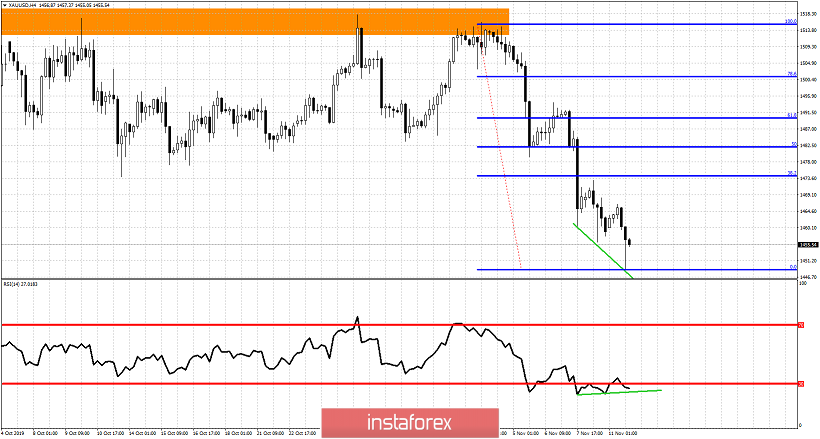
Green lines - bullish divergence
The RSI is providing us with some bullish divergence signs in the 4 hour chart. Price is still making lower lows and lower highs, however I expect this to change. Resistance is at $1,466 and breaking above it could push price at least towards $1,474 where we find the 38% Fibonacci retracement of the recent decline. Major Fibonacci resistance is at $1,490. Remember that $1,490 was also a very important support on the way down, so it is very possible to see a back test of that area. At current levels I prefer to be cautious and if short I would take partial profits and lower stops. I would not be bullish trying to trade the bounce, rather I would prefer to wait for the bounce to give me another opportunity to sell.


