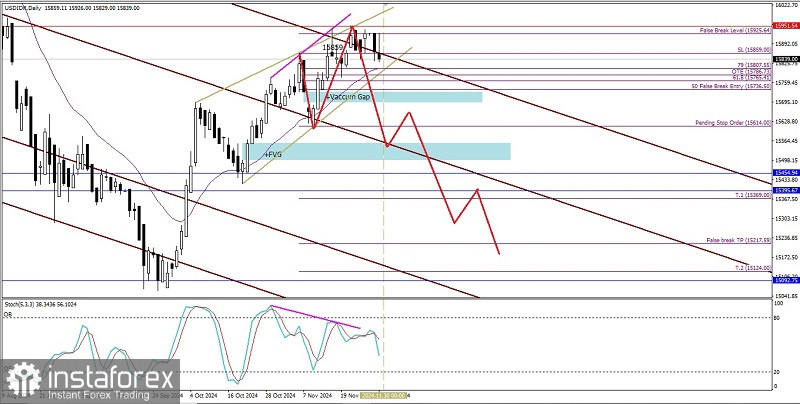
Although on the daily chart USD/IDR appears to be strengthening, if observed, USD/IDR is actually moving harmoniously in a downward channel coupled with confirmation of the appearance of a Rising Wedge pattern and deviations between price movements that create Higher-High while the Stochastic Oscillator indicator actually forms Higher-Low, giving sufficient clues that in the next few days USD/IDR has the potential to weaken where the level of 15736.50 will be tested and breaks by USD/IDR and if this level is successfully exceeded, USD/IDR has the potential to continue its weakening to the level of 15454.94 and if the momentum and volatility support it, 15217.59 will be the next target to be aimed for, but all of this will be invalid and canceled by itself if on its way to the previously described target levels, USD/IDR suddenly strengthens again and breaks as well as closes above the level of 15951.54.
(Disclaimer)


