


Gold price reached $1,478 today but price could not stay for long above the 38% Fibonacci retracement resistance. This is a sign of weakness. Price is now trading below this resistance at $1,467. Gold price is pulling back towards short-term support of $1,464 but as long as price is above $1,455 we could see another move higher towards $1,490. Medium-term trend remains bearish as long as price is below $1,500-$1,525.
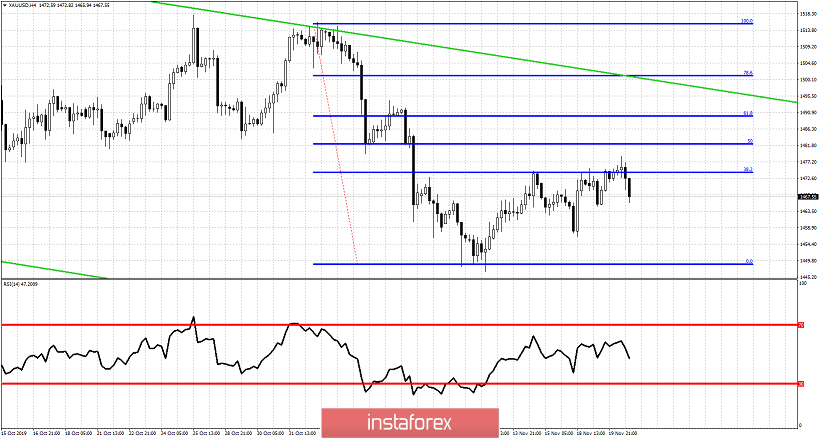
Gold price is making higher highs and higher lows in the 4 hour chart after bottoming below $1,450. We warned bears then that a bounce was coming. This bounce might yet be not finished. We could see price move towards the 61.8% Fibonacci retracement level. This bounce is considered a selling opportunity. I'm bearish Gold as long as we trade below $1,500.


