Technical Market Overview:
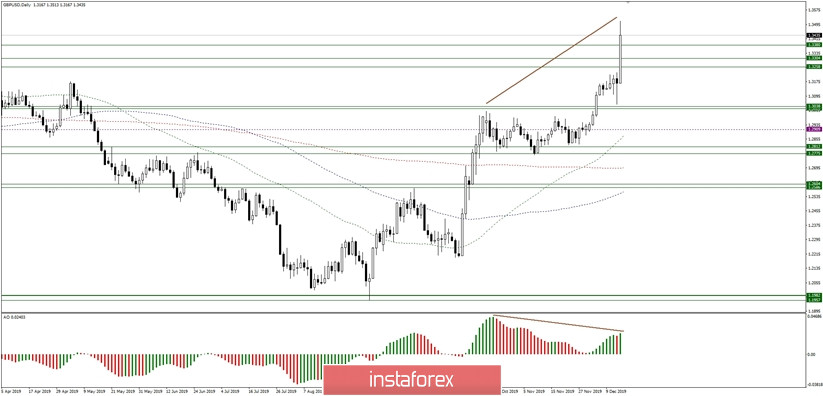
Despite the Shooting Star candlestick pattern visible on the H4 timeframe chart, the GBP/USD pair has made another higher high located at the level of 1.3513 in overbought market conditions. The move-up has broken through the technical resistance level located at 1.3380 and now is test the weekly technical resistance level located at 1.3509. Please notice, there is a clear bearish divergence between the price and the momentum visible at the daily timeframe chart, so another leg up might not be that much dynamic like the last one.
Weekly Pivot Points:
WR3 - 1.3526
WR2 - 1.3331
WR1 - 1.3236
Weekly Pivot - 1.3076
WS1 - 1.2988
WS2 - 1.2812
WS3 - 1.2727
Trading recommendations:
The best strategy for current market conditions is to trade with the larger timeframe trend, which is up. All downward moves will be treated as local corrections in the uptrend. In order to reverse the trend from up to down, the key level for bulls is seen at 1.2756 and it must be clearly violated. The key long-term technical support is seen at the level of 1.2231 - 1.2224 and the key long-term technical resistance is located at the level of 1.3509.