


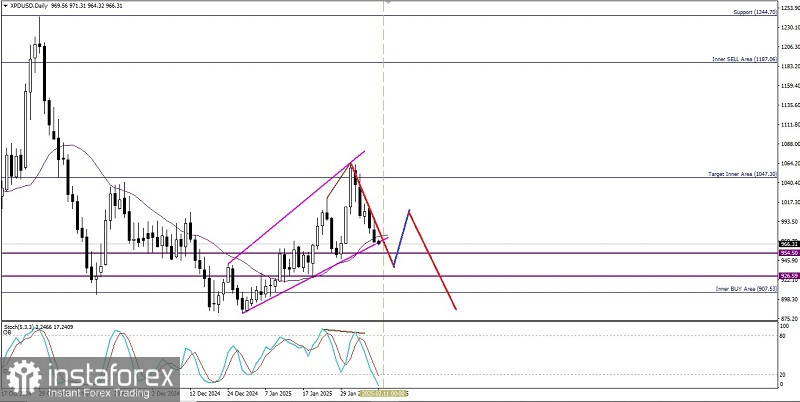
If we look at the daily chart of XPD/USD, we will see some interesting things, first is the appearance of the Ascending Broadening Wedge pattern and the divergence between the XPD/USD price movement and the Stochastic Oscillator indicator and it is also confirmed that the current XPD/USD price movement is also below the WMA (30 Shift 2) so that based on these facts, in the next few days, as long as there is no strengthening retracement that breaks through and closes above the level of 1065.29 XPD/USD in the next few days has the potential to fall to the area level of 954..50-926.59 if this area level is successfully broken and closes below it, this will be a sign that the momentum of weakening and volatility supports it so that XPD/USD has the potential to continue its weakening back to the level of 907.53.
(Disclaimer)


