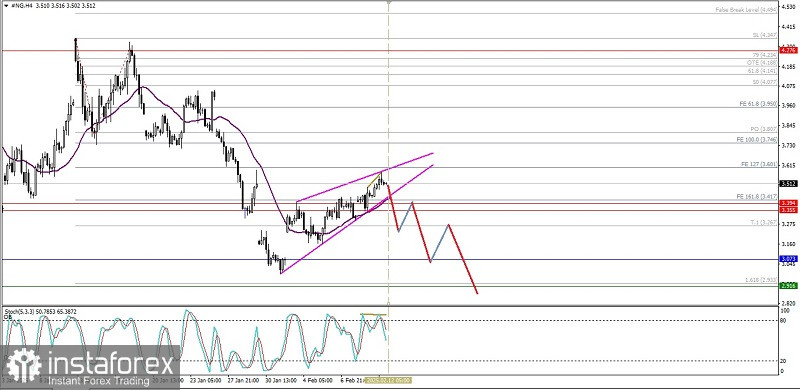
There are two interesting things on the 4-hour chart of the Natural Gas commodity instrument, first the emergence of the Rising Wedge pattern and second the divergence between the #NG price movement and the Stochastic Oscillator indicator where both of these things confirm that in the near future #NG has the potential to be corrected to weaken downwards where the area level of 3.394-3.335 will be tested and broken, and closed below it. So that as long as there is no significant strengthening again where #NG manages to breaks and close above the level of 3.601 then #NG has the potential to continue its decline to 3.073 as its main target and if the momentum of weakening and volatility support then 2.916 will be the next target.
(Disclaimer)


