


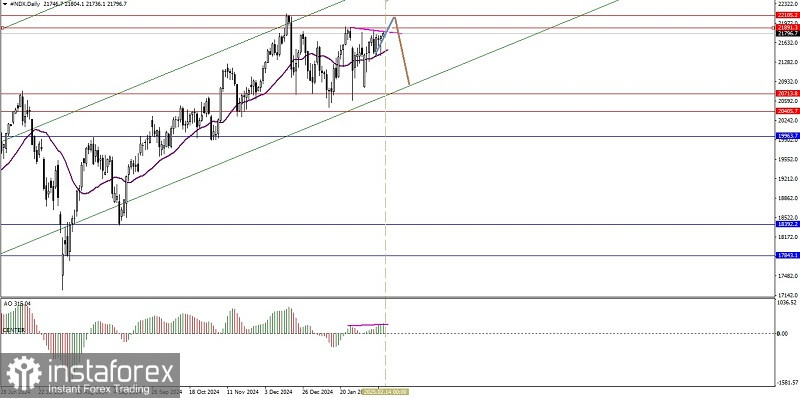
Although currently on its daily chart the Nasdaq 100 index is still moving up where this is confirmed by its movement which is still moving in the Bullish Pitchfork channel and is above the WMA (30 Shift 2) and has a slope that dives upwards coupled with the appearance of convergence between the #NDX price movement and the Stochastic Oscillator indicator gives an indication that in the near future #NDX has the potential to strengthen up to test the area level of 21891.3-22105.2 but if there is a weakening correction that breaks through and closes below the level of 21382.9 it will hold back the rate of strengthening #NDX so that the rate of strengthening #NDX will be held back and has the potential to become a ranging/Sideways condition.
(Disclaimer)


