


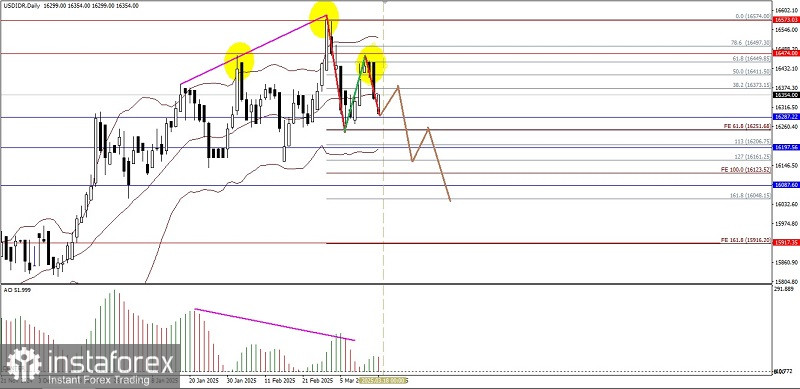
On the 4-hour chart, the exotic currency pair USD/IDR appears to have a Head & Shoulders pattern, especially supported by the Divergence between the USD/IDR price movement and the Awesome Oscillator indicator and the failure of USD/IDR to touch the Upper Line of the Bollinger Band, so in the near future USD/IDR has the potential to weaken down where the level of 16251.68 will be tested if this level is successfully broken below then USD/IDR has the potential to continue its weakening to 16161.25 and if the volatility and momentum of the weakening are strong enough then 16048.15 will be the next target to be targeted, however, if on its way to these targets there is suddenly a significant strengthening of USD/IDR until it breaks through and closes above the level of 16474.00 then the weakening scenario that has been described previously will be invalid and canceled by itself.
(Disclaimer)


