


In our previous analysis on USDCAD we observed a bullish flag pattern in the making as price was moving sideways. Price has now recaptured our key resistance at 1.3080-1.31 and has given us a bullish signal with 1.3180 as target, as we explained in our last post.
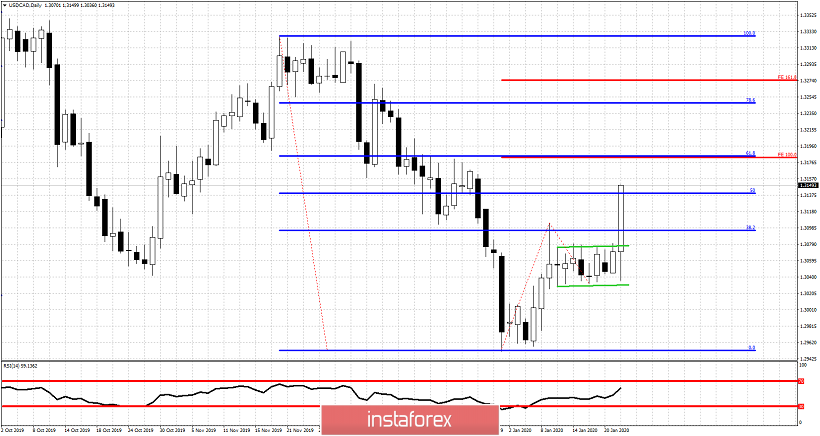
Red lines - Fibonacci extension targets
USDCAD has clearly broken out of the bullish flag and is approaching our first target at 1.3180 where we find the 100% extension of the first upward move. I expect price to reach that level as we can also find there the important 61.8% Fibonacci retracement level. Next target is at 1.3275. If we manage to break above 1.3180 and hold above it, then we can see a move towards 1.33 unfold. Support is key at 1.3080 and bulls do not want to see price pull back below this level. This would be a very bearish signal.


