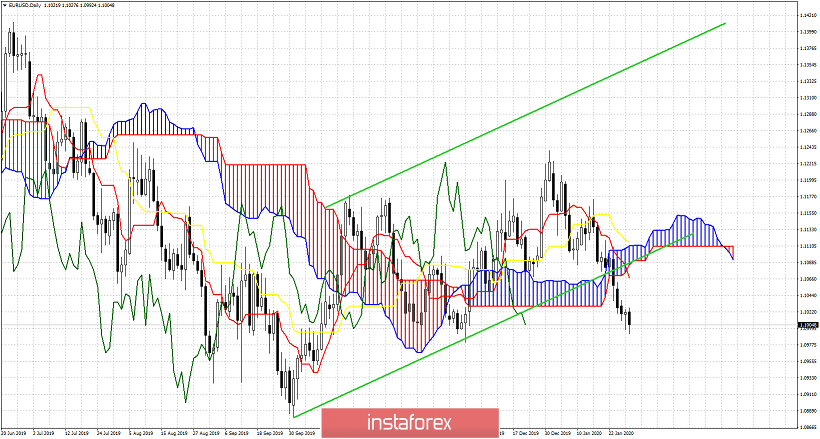
EURUSD has provided us in previous posts with two sell signals according the Ichimoku indicator. The first was a weak sell signal when the tenkan-sen crossed below the kijun-sen. This happened when price was trading at 1.1130. The second sell signal came when price broke below the Kumo (cloud).

The second sell signal came when price broke below the cloud at 1.1035 and at the same time exited the bullish channel. Price is now at 1.10 with next support at 1.0970. Resistance is at 1.1075 and as long as price is below that level trend remains bearish.


