


GBPUSD has challenged for the 5th time the support trend line connecting the lows from 1.2768. As long as price is above this trend line we could see a move higher...however price bounces off that trend line but does not manage to make a higher high.
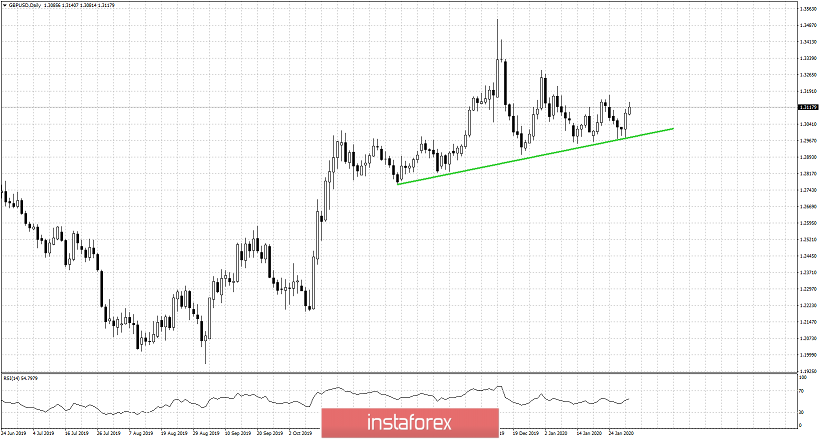
GBPUSD has respected this green trend line as shown in the chart above. However after each bounce, price made a lower high.. Is this a triangle formation or a Head and shoulders formation. One thing is for sure. If price breaks below the recent lows and the green trend line support, we could see a nice sell off towards 1.27. On the other hand if price breaks above the recent high at 1.3175, we could have another try towards 1.33-1.34.


