


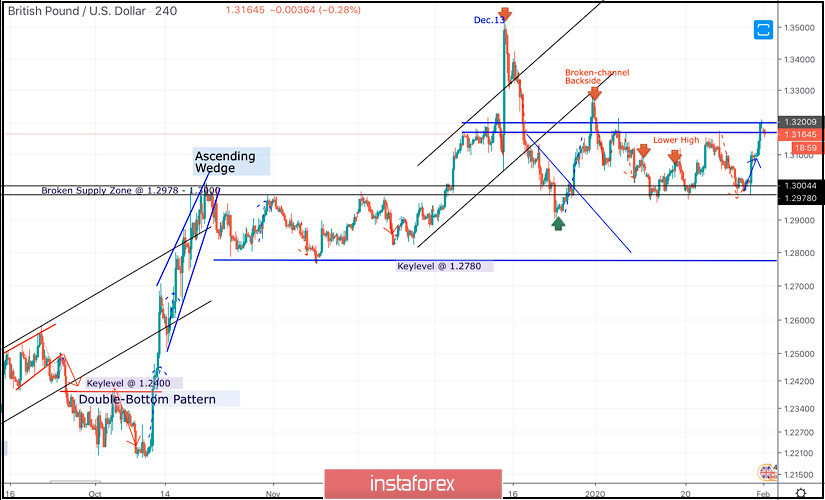
On December 13, the GBPUSD pair looked overpriced around the price levels of 1.3500 while exceeding the upper limit of the newly-established bullish channel.
On the period between December 18 - 23, bearish breakout below the depicted channel followed by initial bearish closure below 1.3000 were demonstrated on the H4 chart.
However, earlier signs of bullish recovery were manifested around 1.2900 denoting high probability of bullish pullback to be expected.
Thus, Intraday technical outlook turned into bullish after the GBP/USD has failed to maintain bearish persistence below the newly-established downtrend line.
That's why, bullish breakout above 1.3000 allowed the recent Intraday bullish pullback to pursue towards 1.3250 (the backside of the broken channel) where bearish rejection and a sideway consolidation range was established between (1.3200-1.2980).
Moreover, new descending highs were recently demonstrated around 1.3120 and 1.3085.
Intraday technical outlook was supposed to remain bearish as long as the pair maintained its movement below 1.3120 (recently established descending high).
That's why, conservative traders were advised to wait for bearish breakdown below 1.2980 as a signal for further bearish decline towards 1.2900, 1.2800 and 1.2780.
However, on Thursday, early signs of bullish recovery have been manifested around 1.2980-1.3000 (Bullish hammer followed by a Bullish Engulfing H4 candlestick).
In the Meanwhile, Intraday traders can watch the current bullish pullback towards the depicted price zone (1.3175 - 1.3200) where another episode of bearish rejection and a valid SELL entry can be considered.
On the other hand, any bullish breakout above 1.3200 ( the upper limit of the consolidation range) enhances further bullish advancement towards 1.3300.


