


In our last analysis on USDCAD, price was at 1.3230 and we pointed out that a bounce was coming. Price bounced towards 1.3280 and then reversed back down to provide us with a new lower low. But the RSI did not follow.
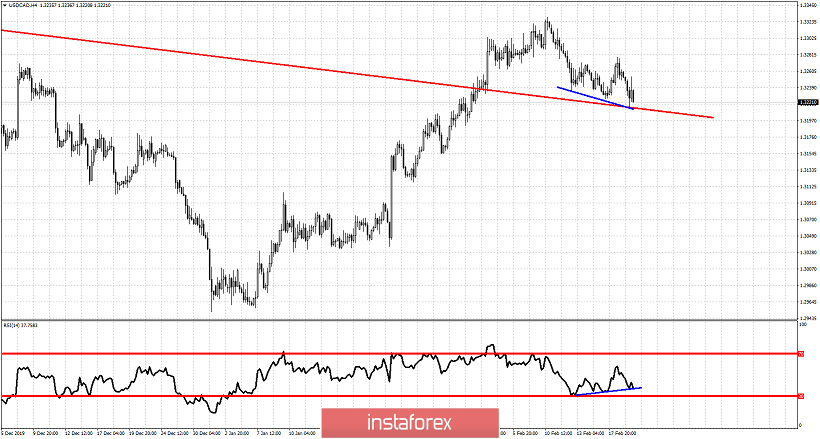
Blue line- bullish divergence
This is the second time we see a lower low and RSI not following to new lows. This is a three drive pattern and it implies that there are many chances of a bigger upward move-reversal even above 1.3280. The blue line in the RSI points out the divergence but also works as a support trend line connecting the higher lows. I believe there are high chances we see USDCAD reverse upwards from current levels towards 1.33-1.34.


