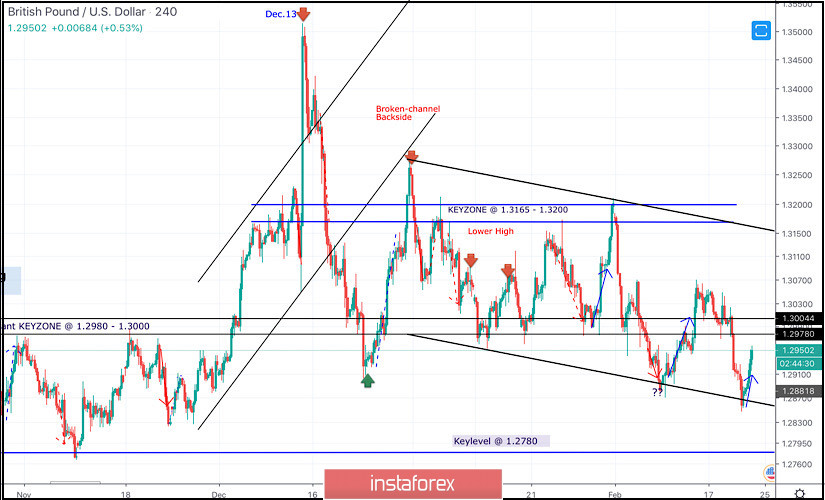
On December 13, the GBPUSD pair looked overpriced around the price levels of 1.3500 while exceeding the upper limit of the depicted bullish channel.
On the period between December 18th - 23rd, bearish breakout below the depicted channel followed by temporary bearish closure below 1.3000 were demonstrated on the H4 chart.
However, immediate bullish recovery (around 1.2900) brought the pair back above 1.3000.
Bullish breakout above 1.3000 allowed the mentioned Intraday bullish pullback to pursue towards 1.3250 (the backside of the broken channel) where bearish rejection and a new wide-ranged movement channel were established between (1.3200-1.2980).
Recently, new descending highs were demonstrated around 1.3200 and 1.3070.
Recent Bearish breakdown below 1.2980 enhanced further bearish decline towards 1.2890 (the lower limit of the movement channe) where evident bullish rejection has been manifested on February 10.
This week, temporary bullish breakout above 1.3000 has been expressed until Wednesday when another bearish decline below 1.3000 was expressed.
As expected, the previous bearish decline below 1.2980 has lead the GBPUSD pair towards the lower limit of the channel @ 1.2870 -1.2850 where significant bullish recovery was recently demonstrated.
The current bullish pullback will probably pursue towards the price zone of 1.2980-1.3000 where price action should be watched again.
Intermediate-term technical outlook is supposed to remain bearish as long as the pair maintains its movement below 1.3000 (Supply-zone).
On the other hand, bullish breakout above 1.3000 invalidates the bearish scenario for the intermediate-term.


