


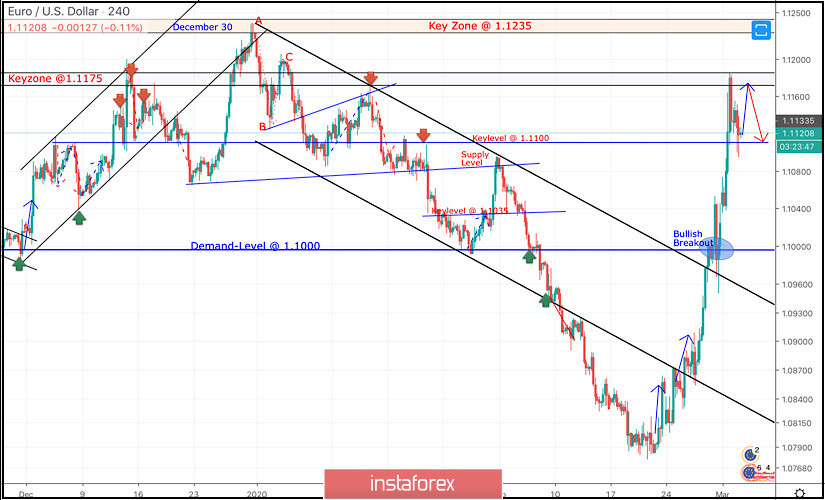
On December 30, a bearish ABC reversal pattern was initiated around 1.1235 (Previous Key-zone) just before another bearish movement could take place towards 1.1100 (In the meanwhile, the EURUSD pair was losing much of its bearish momentum).
One more bullish pullback was executed towards 1.1175 where the depicted key-zone as well as the recently-broken uptrend were located.
Since then, the pair has been down-trending within the depicted bearish channel until two weeks ago, when extensive bearish decline established a new low around 1.0790.
This was where the EUR/USD pair looked oversold after such a long bearish decline.
Hence, Intraday traders were advised to look for signs of bullish recovery around the price levels of (1.0790).
By the end of Last week, recent signs of bullish recovery were manifested around 1.0790 leading to the current bullish movement towards 1.0910, 1.0950 and 1.1000.
The price level of (1.1000) constituted a temporary SUPPLY level in confluence with the upper limit of the current movement channel.
That's why, transient bearish pullback was executed towards 1.0950 (Backside of the broken channel) where another bullish swing was initiated.
Yesterday, a quick bullish spike was expressed above 1.1100 (Previous Key-Level). Further bullish advancement was anticipated towards 1.1175 where the current bearish pullback was initiated earlier Today.
Currently, the EURUSD pair is retesting the KeyLevel around 1.1100 where another bullish swing is expected to be initiated towards 1.1175 and probably 1.1235.
On the other hand, bearish breakout below 1.1100 will probably bring further bearish decline towards 1.1040 and possibly 1.1000.


