


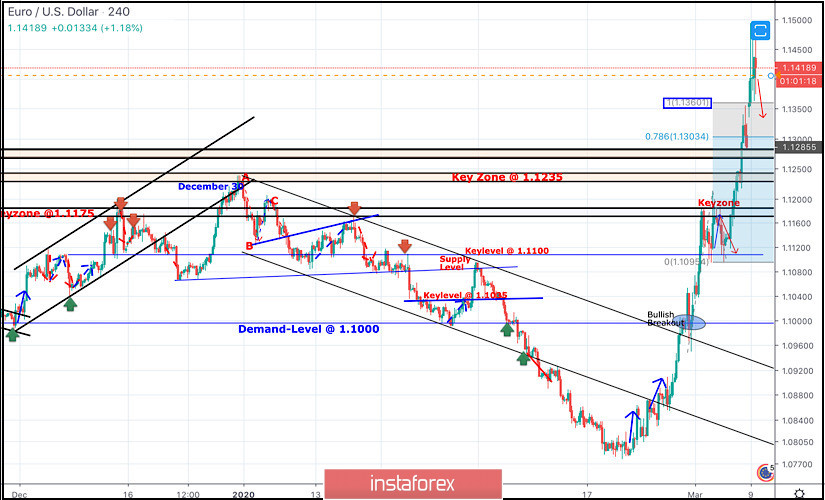
On December 30, a bearish ABC reversal pattern was initiated around 1.1235 (Previous Key-zone) just before another bearish movement could take place towards 1.1100 (In the meanwhile, the EURUSD pair was losing much of its bearish momentum).
One more bullish pullback was executed towards 1.1175 where the depicted key-zone as well as the recently-broken uptrend were located.
Since then, the pair has trended-down within the depicted bearish channel until two weeks ago, when extensive bearish decline established a new low around 1.0790.
This was where the EUR/USD pair looked oversold after such a long bearish decline.
Hence, Intraday traders were advised to look for signs of bullish recovery around the price levels of (1.0790).
On February 20, recent signs of bullish recovery were demonstrated around 1.0790 leading to the current bullish movement towards 1.1000, 1.1175 and 1.1235.
The price level of (1.1175) constituted a temporary SUPPLY level in confluence with the origin of the previously-mentioned ABC pattern.
That's why, transient congestion-zone was established down to 1.1100-1.1095 where another bullish swing was initiated towards 1.1300, 1.1360 and 1.1480.
Currently, the price-Level of 1.1360 (100% Fibo Expansion) is being breached to the upside by the EURUSD pair.
That's why, bearish rejection is anticipated around the current price level of 1.1480 (Supported with being OVERBOUGHT) with bearish targets around 1.1360, 1.1300 and 1.1235.
Otherwise, Bullish Breakout above 1.1480 enables further upward movement towards a more dependable Supply-Zone.


