


What signals has the Ichimoku cloud indicator given this far in Gold? We observe the 4 hour chart in Gold and point out the signals given during the last few days and how the COVID-19 crisis has pushed volatility off the roof for Gold prices as well.
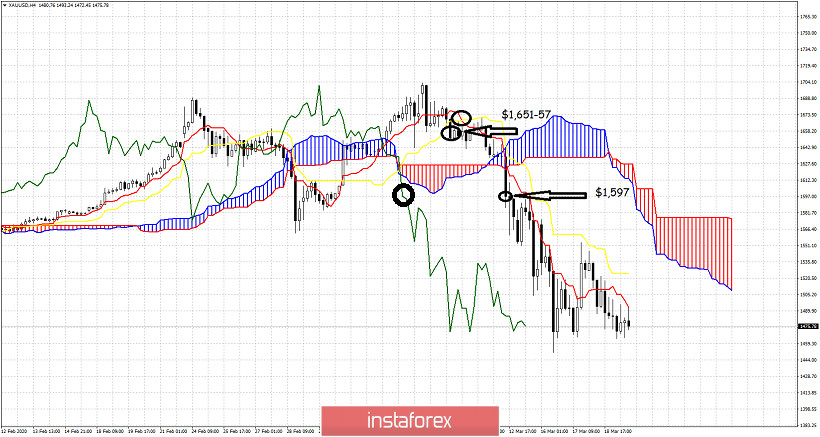
The first bearish signal in the 4 hour chart in Gold was given when price broke down below both the tenkan-sen (red line indicator) and the kijun-sen (yellow line indicator) at $1,651. The next bearish signal was given at $1,657 when the tenkan-sen crossed below the kijun-sen. The confirmation of these bearish signals and the strongest bearish signal was given when the 4 hour candlestick closed below the Kumo and at the same time the Chikou span (green line indicator) was below the cloud. This signal was given at $1,597. Since then price continues to make lower lows and lower highs. Support is at $1,464 and a 4 hour close below that level will open the way for a move towards $1,430-$1,400. Resistance is at $1,525 and next at $1,570.


