


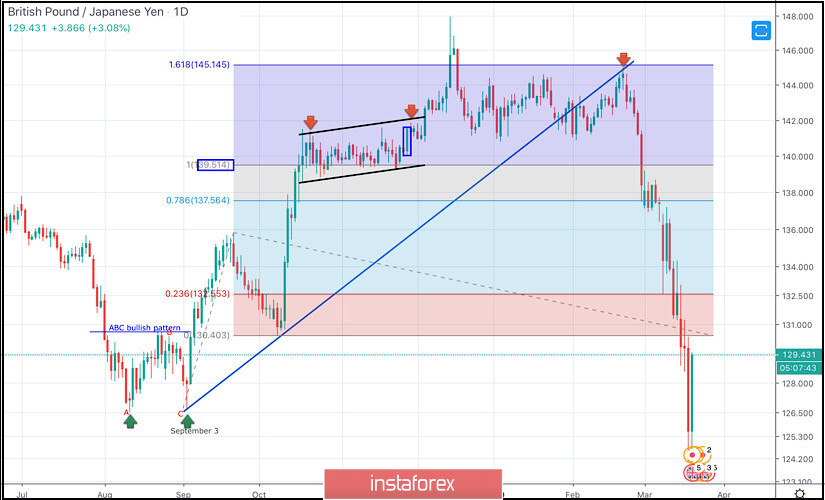
On September the 3rd, the GBPJPY pair initiated the depicted bullish movement uptrend around 126.50
This occurred after the preceding bullish ABC pattern with neckline located around 130.400 has been confirmed.
Since then, the depicted uptrend has been intact until February 3 when the GBP/JPY pair managed to achieve initial bearish breakout below the depicted trend line.
This bearish reversal was confirmed after the GBPJPY pair has failed to achieve a new high above 145.145 on February 21.
Technically, a quick bearish decline was expected towards 139.50 then 137.55, which failed to offer sufficient bullish SUPPORT for the pair.
Hence, further bearish decline was demonstrated towards the next Fibonacci Expansion levels around 132.55 then 130.40 which failed to offer bullish rejection as well.
Recently, the pair has reached new LOW price levels around 124.10 where it looks OVERSOLD. This is where the current daily bullish engulfing Candlestick has originated.
The current bullish movement is expected to pursue towards 130.40 then 132.55 if enough bullish momentum is expressed.
Moreover, conservative traders should wait for bullish breakout above 132.55 as this will probably enable further bullish advancement towards 137.56.


