


Gold price seems to have stabilized its advance around $1,620. Price is moving mostly sideways the last couple of sessions, but I expect price to roll over downwards soon and break below $1,600 towards $1,570.
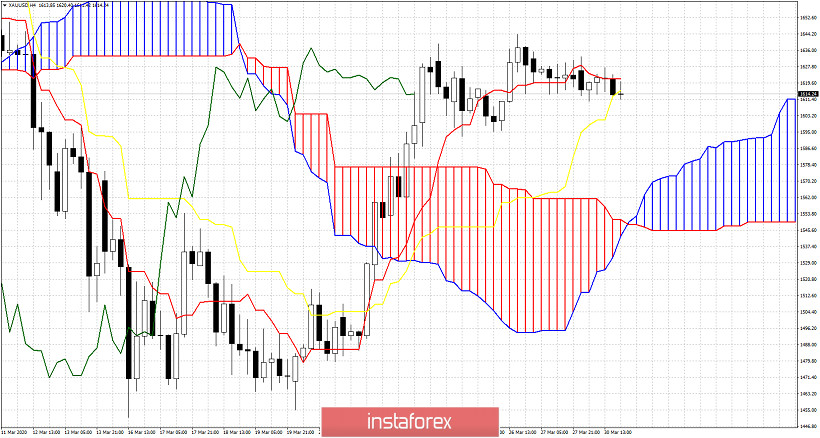
Gold price is above the 4 hour Kumo (cloud) but vulnerable to a move lower. Price is below the tenkan-sen (red line indicator). A 4 hour close below the kijun-sen (yellow line indicator) will increase chances of a move towards cloud support at $1,570. This is our first target if we see a solid close below $1,610.
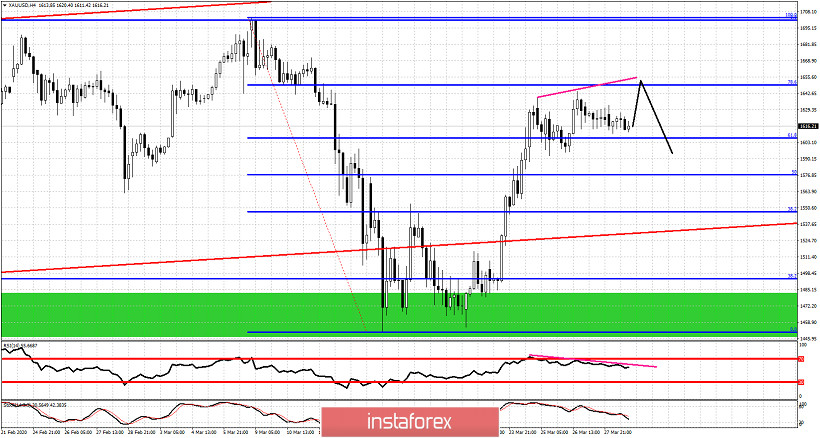
Black line -possible price path
Blue horizontal lines - Fibonacci retracement levels
Gold price is trading around the 61.8% Fibonacci retracement. As long as price holds above $1,600-$1,610, we favor a push towards $1,640-50 to complete a triple top bearish divergence....assuming the RSI does not make a higher high and gets rejected by the pink resistance trend line. Gold could make a new top at the 78.6% Fibonacci retracement but it is not necessary. In any case I'm expecting Gold to move lower over the next couple of weeks.


