


The Dollar index had a strong week as price bounced off key Fibonacci support at 98.20 all the way to 100.85 where the rise stopped at another important Fibonacci resistance area. Longer-term trend remains bullish and as long as price is above 94.60 bulls remain in control.
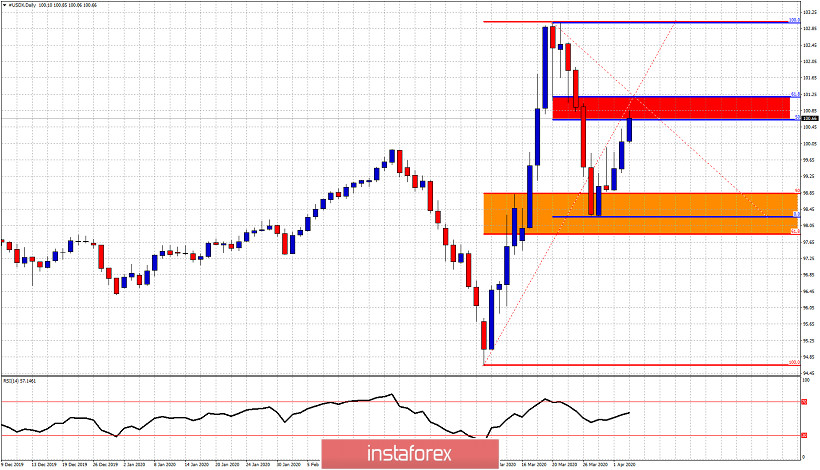
Red rectangle - resistance
The Dollar index has stopped its rise just above the 50% Fibonacci retracement of the recent decline from 103 to 98.29. Breaking above the red rectangle resistance would be an important bullish sign that will increase the chances of seeing a move above 103. Despite the bearish divergence in the RSI in the Daily chart, as long as price is above 98.20 the chances of making a higher high above 103 remain high. If price breaks below the orange rectangle the chances of approaching the 95-94 level will increase dramatically. If at the start of next week we see a rejection of price around the red rectangle then we should expect a pull back towards the orange support area.


