


Gold price remains in a bullish trend as we have confirmed in our previous analysis. Gold price not only reached our target of $1,680, but price broke above $1,710 today providing a new 2020 high.
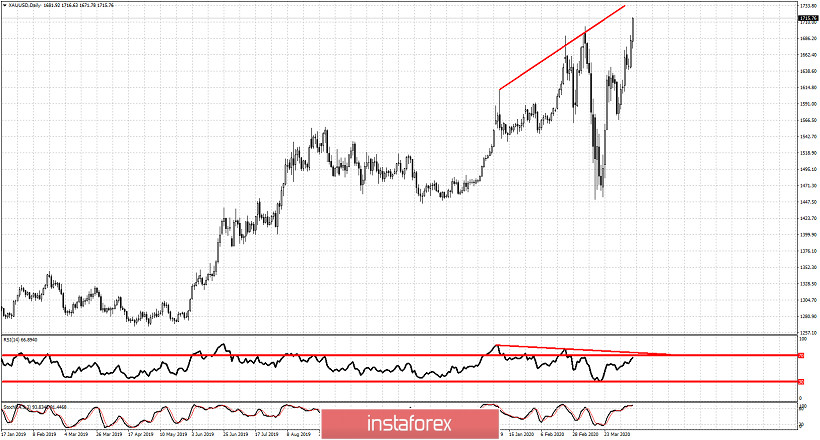
Gold price has broken above the H&S neckline resistance as we showed in a previous analysis. In the 4 hour chart the bearish divergence was broken. This increased the chances of a break out above $1,680. But on the Daily chart as shown above Gold price is making another bearish RSI divergence. This is a warning yes, but not a reversal signal. Bulls need to be cautious. Support is key now at $1,660-80 area. Bulls do not want to see that area break down.
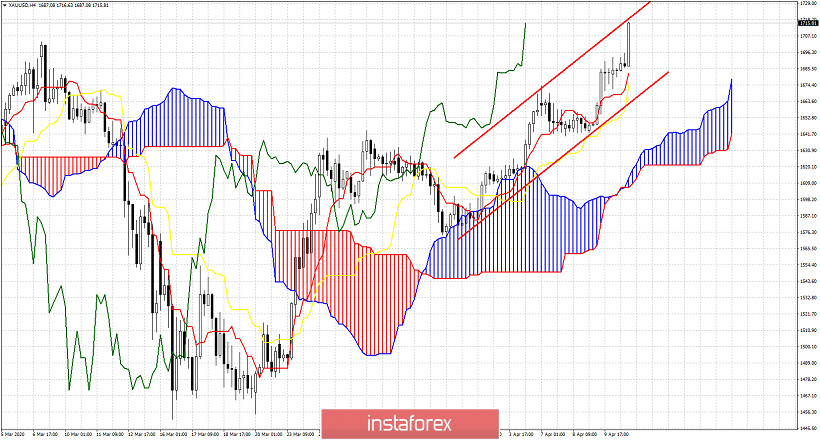
Gold price is in bullish trend according to the Ichimoku cloud. Support is confirmed at $1,660. Bulls do not want price to break below the Kumo at $1.620. The first bearish signal will come if price breaks $1,675-60 area. Bulls better raise their stops to protect gains. The longer-term Daily chart as shown above is worrying me. Bulls do not want to see this new higher high transform into a fake break out.


