


USDCAD continues to make lower lows and lower highs since the mid March top. Trend remains bearish. Price is now forming a downward sloping wedge pattern but has also broken below the horizontal support of 1.3920.
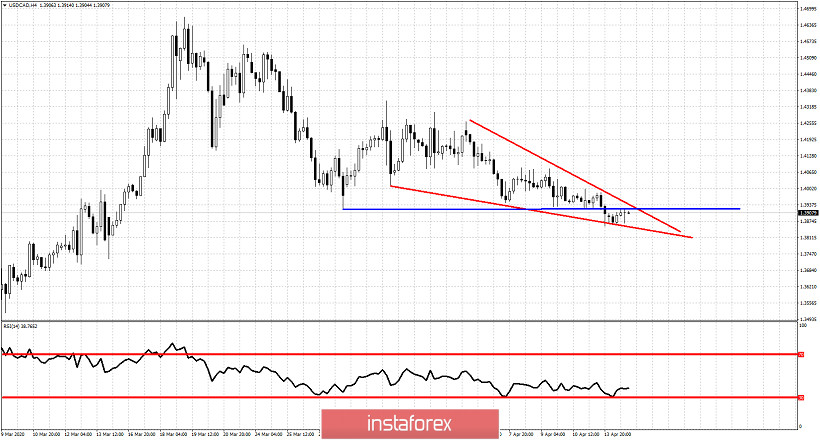
Blue line - horizontal support
USDCAD has broken below the horizontal support and is now back testing it. A rejection at 1.3920 will open the way for a push lower towards 1.3850 at least. This is where we find the lower wedge boundary. This is short-term support. Resistance is at 1.3935-1.3930. A break above the upper wedge boundary resistance would be a bullish sign. So we have to take into consideration both the bullish potential if price breaks above the wedge and the bearish scenario if price gets rejected at 1.3920 and continues below 1.3845.


