


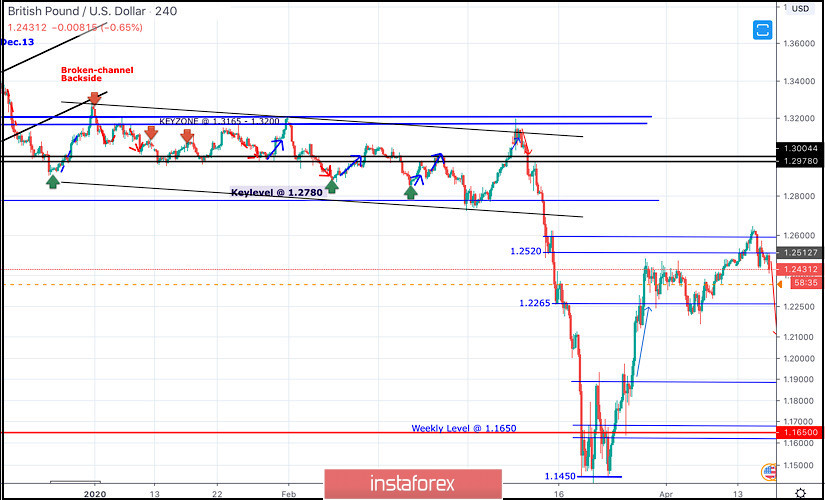
Recently, the GBPUSD has reached new LOW price levels around 1.1450, slightly below the historical low (1.1650) achieved in September 2016.
That's when the pair looked very OVERSOLD around the price levels of 1.1450 where a double-bottom reversal pattern was recently demonstrated as depicted on the chart.
Technical outlook will probably remain bullish if bullish persistence is maintained above 1.1890-1.1900 (Double-Bottom Neckline) on the H4 Charts.
Bullish breakout above 1.1900 (Latest Descending High) invalidated the bearish scenario temporarily & enabled a quick bullish movement to occur towards 1.2260.
Next bullish targets around 1.2520 and 1.2680 were expected to be addressed if sufficient bullish momentum was maintained.
However, early bearish pressure signs have originated around 1.2470 leading to the previous bearish decline towards 1.2265.
That's why, H4 Candlestick re-closure below 1.2265 was needed to hinder further bullish advancement and enhance the bearish momentum on the short term.
On the other hand, the current bullish persistence above 1.2265 has enhanced another bullish pullback movement up to the price levels of 1.2520-1.2590 where early signs of bearish rejection are being demonstrated.
A bearish reversal pattern may be in progress. That's why, the current bearish decline below 1.2520 is probably confirming this reversal pattern.
Bearish persistence below 1.2520 enhances another bearish movement towards 1.2265 where price action should be evaluated again.
Trade recommendations :
Conservative traders were looking for bearish rejection during the recent bullish spike above 1.2550-1.2600 as suggested previously.
T/P level to be located around 1.2265 1.2100 and 1.2000 while S/L should be placed above 1.2630.


