Main Quotes Calendar Forum
flag

FX.co ★ Ichimoku cloud indicator analysis of Gold

parent
Forex Analysis:::2020-04-28T13:16:43

Ichimoku cloud indicator analysis of Gold

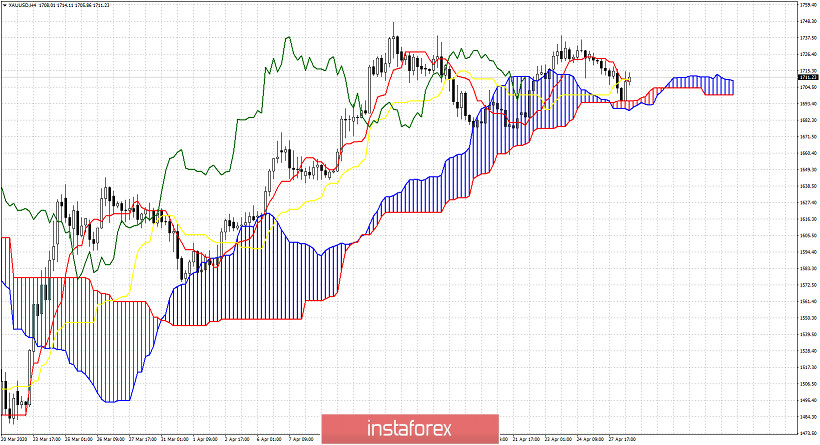
Gold price is challenging short-term Ichimoku cloud support and so far bulls remain in control of the trend. Gold price pulled back towards $1,690 and is now bouncing back above $1,700. Gold price remains vulnerable to a deeper decline but we should not ignore the bullish Head and Shoulders pattern we mentioned in our last analysis.

Ichimoku cloud indicator analysis of Gold

The tenkan-sen (red line indicator) has crossed below the Kijun-sen (yellow line indicator). This is a weak sell signal that we should not ignore. Combined with the bearish divergence we have been talking about in our previous analysis, bulls need to be very cautious. Specially after today's bounce off the 4 hour cloud support. A break below today's low will be a medium bearish sell signal.

Ichimoku cloud indicator analysis of Gold

Black lines - Head and shoulders pattern

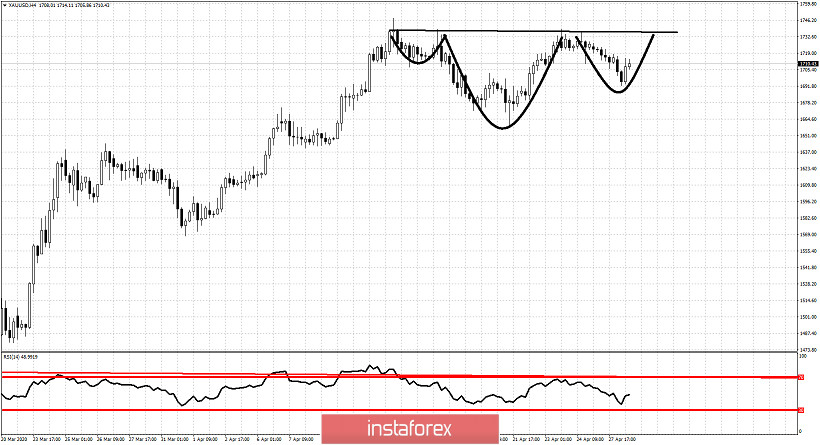
On the other hand we might be forming a right hand shoulder as we mentioned in yesterday's analysis. If price manages to break above $1,737 we should see a strong move higher to new 2020 highs. If however price breaks below today's lows, we should be very confident that a top is in. Gold remains vulnerable to a big decline towards $1,600. I do not give many chances of this up trend to stay valid for much longer.

Analyst InstaForex
Share this article:
parent
loader...
all-was_read__icon
You have watched all the best publications
presently.
We are already looking for something interesting for you...
all-was_read__star
Recently published:
loader...
More recent publications...