Main Quotes Calendar Forum
flag

FX.co ★ Gold continues its sideways movement

parent
Forex Analysis:::2020-04-29T11:59:08

Gold continues its sideways movement

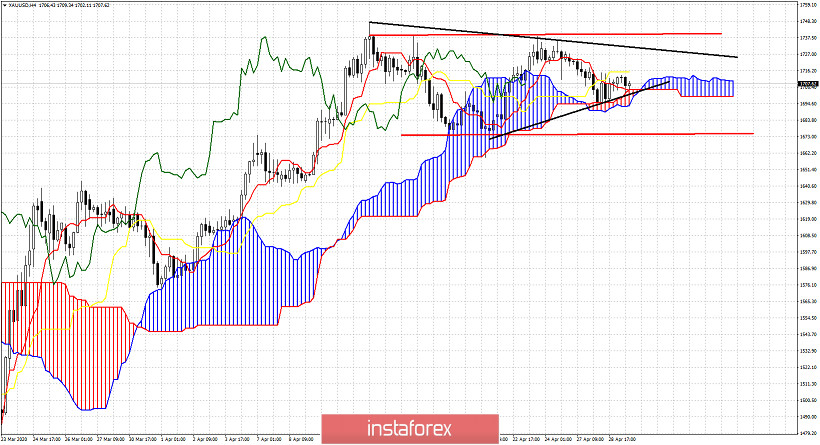
Gold price continues to move inside the trading range of $1,750 and $1,670 since mid April. Price has no clear direction. We expect to get some signals if certain support or resistance levels break. Both bullish and bearish scenarios are still open. Medium-term trend remains bullish, but we lean more on the bearish scenario.
Gold continues its sideways movement

Red lines - trading range

Black lines - triangle pattern

Gold price is challenging the Ichimoku cloud support. So far this support has been respected. Breaking below $1,694 will be a bearish sign according to the Ichimoku indicator. At the same time price would have broken the lower triangle boundary. Another bearish sign. If price exits the trading range then we should expect more strength towards the same direction with the break out.
Gold continues its sideways movement

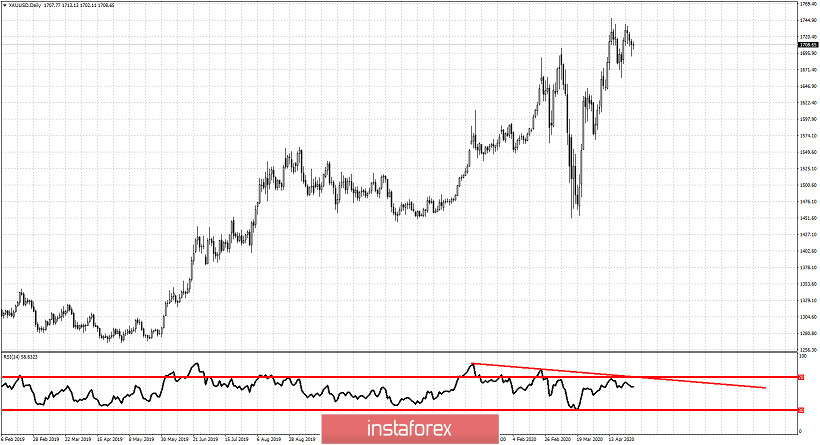
My view remains bearish mainly because of this bearish divergence. As long as the RSI is below the red trend line I prefer to be bearish. Trend remains bullish. There are some warning signs for a reversal but we have not seen a confirmed signal yet. Traders both bulls and bears need to be very cautious at current levels.
Analyst InstaForex
Share this article:
parent
loader...
all-was_read__icon
You have watched all the best publications
presently.
We are already looking for something interesting for you...
all-was_read__star
Recently published:
loader...
More recent publications...