


Gold price remains inside the trading range we have been talking about the last few days. Price has entered the 4 hour cloud area and is trying to break above key resistance at $1,710-20. Daily trend remains bullish. We continue to feel Gold price is vulnerable to the downside.
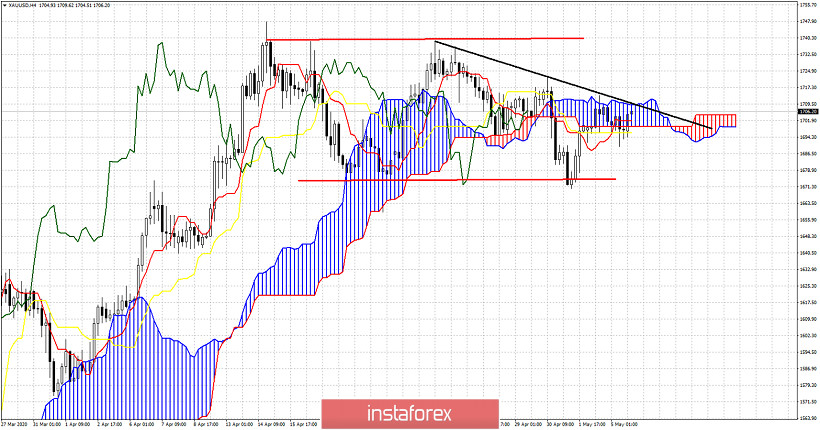
Red lines - trading range
Black line - short-term resistance trend line
Gold price is inside the 4 hour cloud. This implies that trend in the 4 hour chart is neutral. Price has also touched the black downward sloping trend line 3 times so I believe it is an important factor to keep in mind. Whether we see a rejection or a break out, $1,710 is a confluence of resistance both by pure technical analysis and also confirmed by the Ichimoku cloud indicator. Breaking above the cloud would be a bullish sign. This would imply a move to $1,740 and higher is possible. On the other hand a rejection here and a move below $1,690 will increase dramatically the chances of a new lower low towards $1,630.


