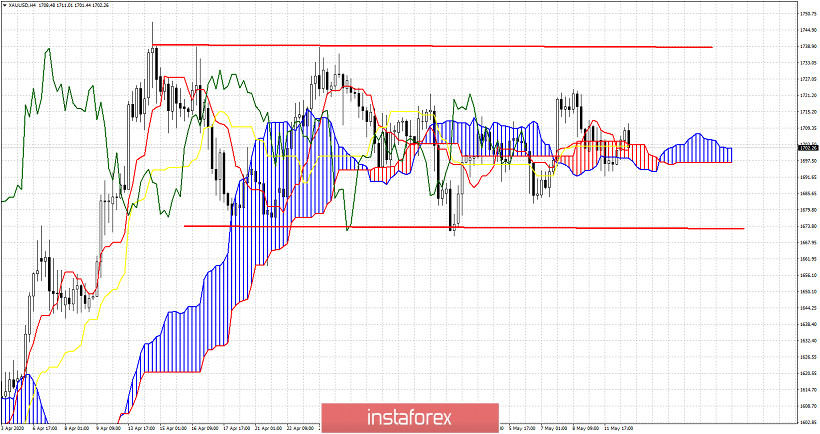
Gold price remains inside the trading range of $1,740-$1,670. Price is moving above and below the Ichimoku cloud in the 4 hour chart. In such sideways movements we prefer to focus on the Daily chart. In the 4 hour chart as shown below price has managed to push back above the cloud again. However this is no clear signal unless price breaks above recent high at $1,723.
In the Daily chart we focus on the kijun-sen which is rising as the major pivot point for the trend and any signal we might get.

Trend remains bullish. The kijun-sen is at $1,678, very close to the lower trading range boundary. Breaking below it will open the way for a move towards $1,630 and the Kumo (cloud). Resistance is at $1,720-25 area. Breaking above it will open the way for new 2020 highs. Although in previous posts we noted that we prefer to be neutral or bearish Gold around $1,740, at this point if we see a move above $1,725 it could be a nice bullish short-term opportunity. But only for the very short-term. Weekly bearish divergence is a big warning sign not to be forgotten.


