


Gold has started the week on a negative note following last week's inability to hold above $1,750. Despite moving higher towards our target of $1,770 last week, price closed around $1,735 and this week prices move lower.
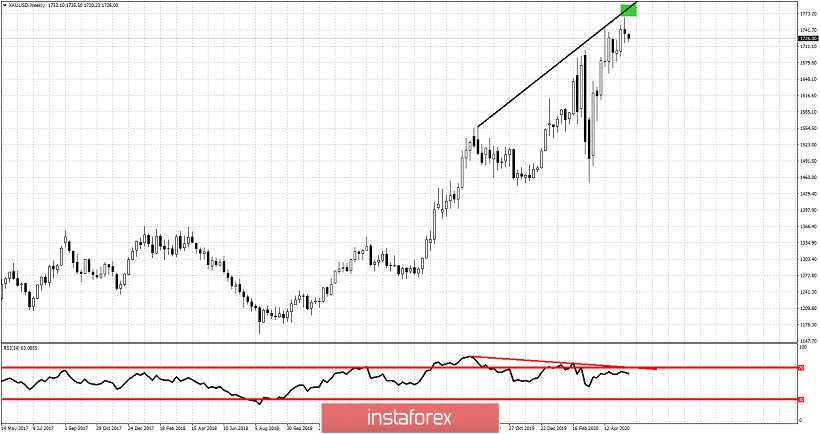
Green rectangle -target area
Black line -higher highs
Gold price is making higher highs but the RSI is not following. Price of the RSI is making lower highs thus providing us with a bearish divergence. This is not a reversal signal but a warning sign for bulls to be extra cautious and raise protective stops. Over the last few weeks our main view was to be bearish Gold around $1,750 and higher, as long as the RSI was diverging. Our short-term view when price broke above $1,710-20 turned bullish targeting $1,770. Last week we came so close to this target area. Now price is turning back down again. Key support remains at $1,710-15. Breaking below this level will open the way for a move towards $1,650 at least. It is important to see if this weekly candle hold above $1,700-10 support.


