


In a previous analysis on USDCAD we mentioned a bearish pattern that was being formed. Price was forming a descending triangle and we said that usually patterns like this break to the downside.
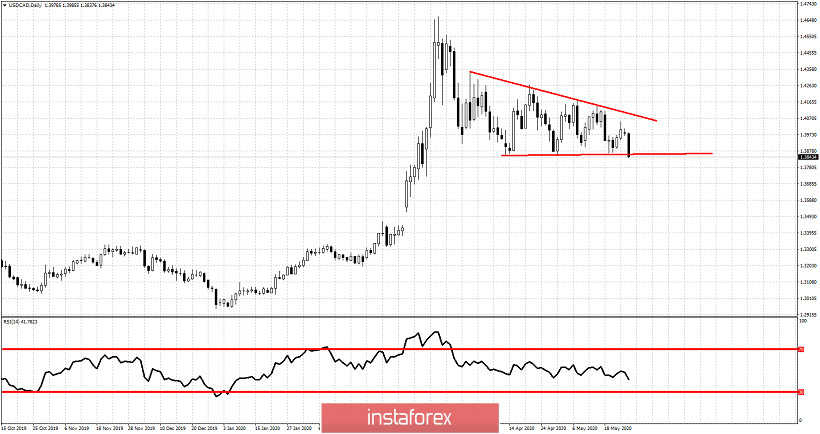
USDCAD has broken below the triple horizontal bottom at 1.3850. A daily close below this level will be a bearish sign. Price could move much lower. Price remains in a bearish trend making lower lows and lower highs. Resistance is at 1.3990 and as long as price is below that level we expect price to move towards 1.35. Next support and first target is at 1.37. Next at 1.35.


