Main Quotes Calendar Forum
flag

FX.co ★ Short-term Ichimoku cloud indicator analysis of Gold

parent
Forex Analysis:::2020-05-27T15:58:51

Short-term Ichimoku cloud indicator analysis of Gold

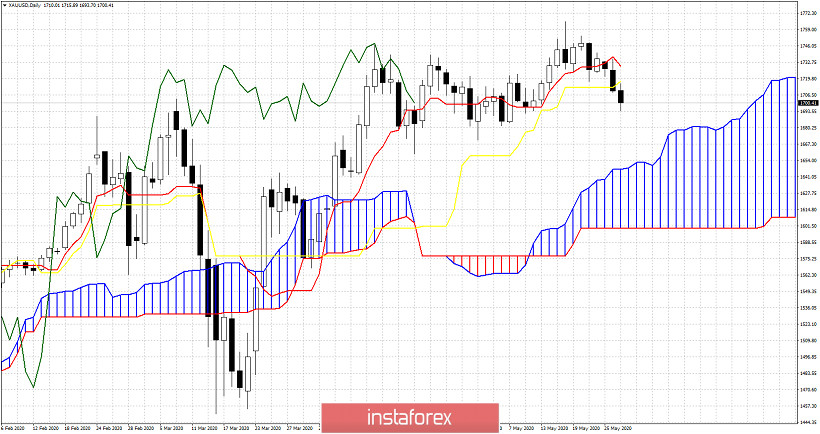
Gold price has broken below key short-term Ichimoku cloud support indicators. Price could continue lower towards $1,650 as long as we stay below $1,700-$1,710. The RSI bearish divergence has warned us when price was making new highs.

Short-term Ichimoku cloud indicator analysis of Gold

Gold price has broken below the key short-term support provided by the kijun-sen (yellow line indicator). The chances for reaching the Ichimoku cloud around $1,650 are high. Price usually pulls back towards cloud support when price breaks below the kijun-sen.

Short-term Ichimoku cloud indicator analysis of Gold

Black line - bearish divergence

Green rectangle - target

Gold price is pulling back after a new higher high and another bearish divergence in the RSI. We have been talking about this divergence since the upward break out of $1,720 and when we were looking for a top near $1,770-80. Now price has broken below $1,700 and the more it stays below it, the higher the chances of seeing lower levels of support. Even if bulls step back in, the upside potential is limited to a move towards $1,780 area.

Analyst InstaForex
Share this article:
parent
loader...
all-was_read__icon
You have watched all the best publications
presently.
We are already looking for something interesting for you...
all-was_read__star
Recently published:
loader...
More recent publications...