Main Quotes Calendar Forum
flag

FX.co ★ Short-term Ichimoku cloud indicator analysis of EURUSD

parent
Forex Analysis:::2020-05-27T16:08:42

Short-term Ichimoku cloud indicator analysis of EURUSD

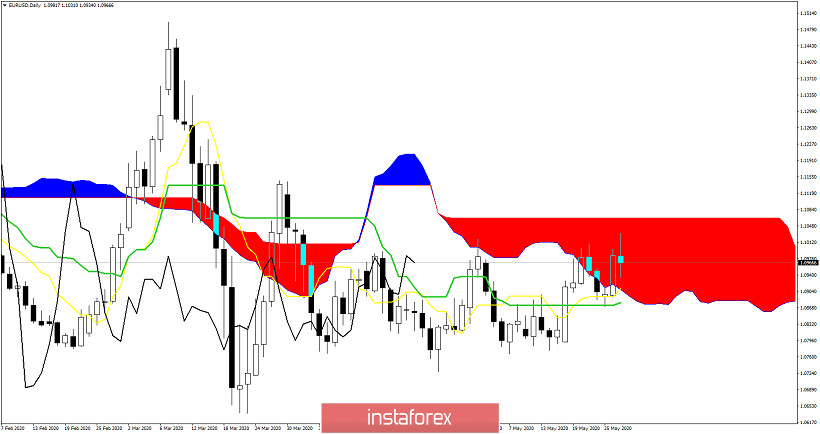
EURUSD has made another try to break above the key Daily horizontal and Ichimoku cloud resistance at 1.10-1.1020 area but has failed. Price remains inside the Kumo (cloud) and we continue to consider trend neutral.

Short-term Ichimoku cloud indicator analysis of EURUSD

EURUSD is trading above both the kijun-sen and tenkan-sen indicators inside the Kumo. Support is key at 1.0905-1.0875. Breaking below this level will increase dramatically the chances of pushing lower towards 1.06. Resistance is at the upper cloud boundary at 1.1065. Today price was unable to break horizontal resistance.

Short-term Ichimoku cloud indicator analysis of EURUSD

Green rectangle - horizontal resistance

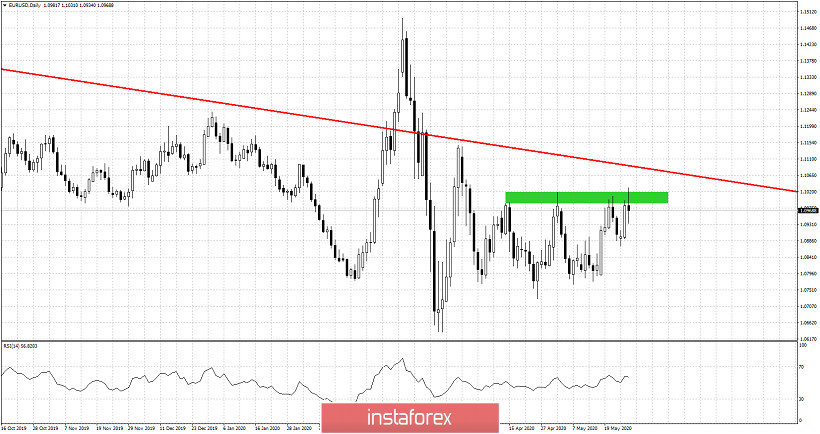
Red line -long-term resistance trend line

EURUSD got rejected at the green rectangle resistance area today and is reversing. This could mean nothing and just be an initial pull back. It is important for the short-term price to stay above 1.0870. Breaking below 1.0870 will increase the importance of the rejection. Horizontal support we find next around 1.08. The market is mostly ranging for the last couple of weeks so it is preferred either to stay neutral or sell near resistance levels and buy near support levels. Stops should be placed on the trading range extremes and if price breaks any of them, we follow the trend.

Analyst InstaForex
Share this article:
parent
loader...
all-was_read__icon
You have watched all the best publications
presently.
We are already looking for something interesting for you...
all-was_read__star
Recently published:
loader...
More recent publications...