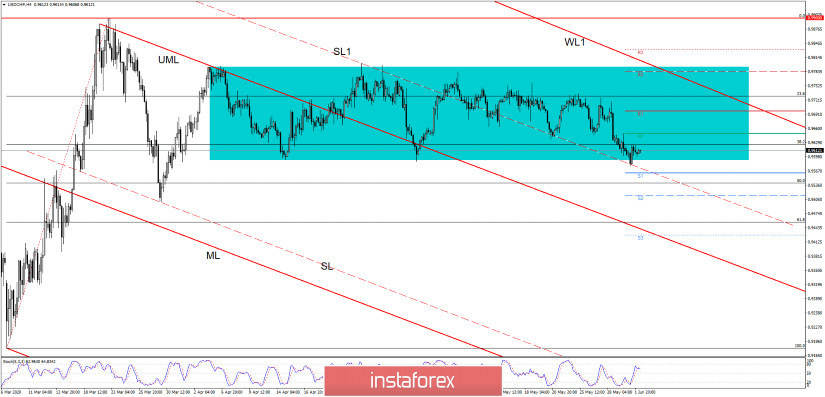
USD/CHF was into a downside movement lately caused by the USDX's sell-off, but now, the price has found strong support in the short term and it could give birth to another leg higher. We may have a reversal in the short term if the Dollar Index rebounds as well. Otherwise, the pair could resume its downside journey.
Unfortunately, the USD stays lower as the US ISM Manufacturing PMI has disappointed a little yesterday, the indicator was reported at 43.1 points, below the 43.5 estimates. Still, the ISM Manufacturing Prices indicator has increased from 35.3 to 40.8 points, beating the 40.0 consensuses, while the Construction Spending decreased only by 2.9%, though economists had expected a 6.5% drop.
USDX is trading below the 98.00 psychological level, but it has started to show some oversold signs, the bullish divergence followed by another higher high. A comeback above the 98.24 level will announce a bullish movement that will suggest a USD/CHF reversal.

USD/CHF has decreased after the failure to reach and retest the 0.9794 range resistance, now it has found support right on the outside sliding line (SL) of the former descending pitchfork. It has registered only a false breakdown below the 0.9591 static support, the bullish engulfing has signaled a potential rebound.
You should be careful because USD/CHF could drop anytime if the USDX will resume its downwards movement. Personally, I believe that only a valid breakout above the weekly Pivot Point (0.9648) could signal a significant increase.
On the other hand, a further drop will be validated by another lower low, a drop below 0.9577 will confirm the range breakdown and will bring a selling opportunity, this scenario will announce an approx 200 pips drop.
- USD/CHF TRADING TIPS
A valid breakdown from this extended range, below 0.9577, will offer us a selling signal, the 61.8% retracement level, the upper median line (UML), and the S3 (0.9428) level could be used as downside targets.
The false breakdown below 0.9591 has signaled a rebound, but personally, I would like to see a breakout and stabilization above the PP (0.9648) before I consider going long, with targets at R1 (0.9697), 23.6% level, the first warning line (WL1), and at the 0.9794 range resistance. A major increase will be signaled only by a valid breakout above the WL1 and from this sideways movement.


