Main Quotes Calendar Forum
flag

FX.co ★ Short-term Ichimoku cloud indicator analysis of Gold

parent
Forex Analysis:::2020-06-15T12:12:27

Short-term Ichimoku cloud indicator analysis of Gold

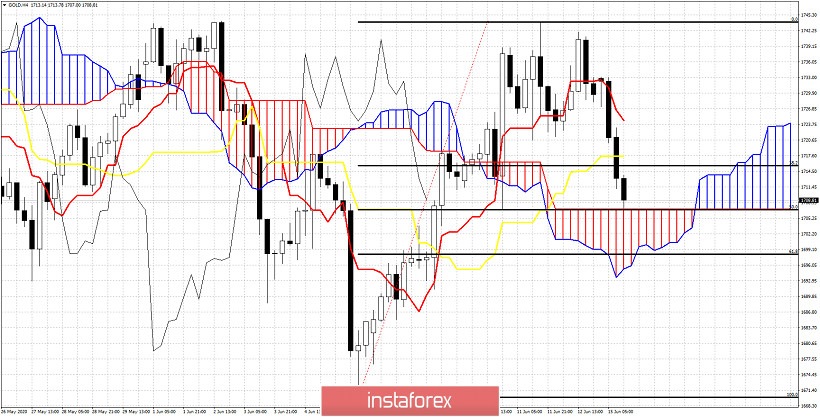
Gold price is pulling back after a short-term upward move from $1,670 to $1,743. Price is testing important cloud and Fibonacci support. Gold price if it bounces from current levels then this would be a bullish sign.

Short-term Ichimoku cloud indicator analysis of Gold

Gold price is above the Ichimoku cloud in the 4 hour chart. Price is pulling back towards cloud support. There we also find the 50% Fibonacci retracement support level. This is key short-term support. Next key support is the lower cloud boundary and 61.8% Fibonacci retracement at the $1,700 area. This is the most important support level. The chances of a bounce and upward reversal are higher in this area around $1,700 and $1,707. So bears need to be very cautious here. This is also a good level to think about opening long positions as the stop is very close by. I would not be bullish if price broke below $1,700 again.
Analyst InstaForex
Share this article:
parent
loader...
all-was_read__icon
You have watched all the best publications
presently.
We are already looking for something interesting for you...
all-was_read__star
Recently published:
loader...
More recent publications...